3 dim surface plots
|
Administrator
|
Some time ago somebody posted syntax for generating 3 d surface plots.
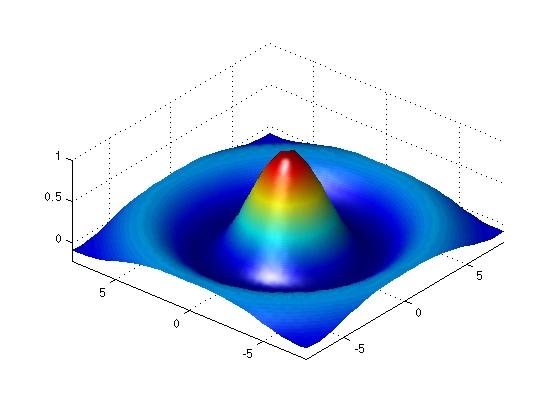
Specifically say I have n,k,m (discrete normally 3..10), phi,rho, delta (continuous). Resulting in a difficult to calculate value p . I would like to obtain a plot of p with phi and rho as the other 2 axes and possible have the n k m as panels or indicated by color. For the moment simply a surface plot of 3 continuous variables would be a start. Visualize a 3 dimensional representation of 2 normally distributed variables (the 3rd dimension being the probability density ) if this helps to describe what I am after. I have been through all the chart dialogs but nothing pops out. I searched these archives for surface plot and contour plot but no joy! I know it is possible because someone posted syntax. I probably even have it somewhere but no luck finding it. This is not the specific function I am after but represents the basic concept.  http://www.mathworks.com/help/matlab/visualize/surface_ex2.jpg Any thoughts from the Graphics mavens in the room?
Please reply to the list and not to my personal email.
Those desiring my consulting or training services please feel free to email me. --- "Nolite dare sanctum canibus neque mittatis margaritas vestras ante porcos ne forte conculcent eas pedibus suis." Cum es damnatorum possederunt porcos iens ut salire off sanguinum cliff in abyssum?" |
|
See http://www.ibm.com/developerworks/forums/thread.jspa?threadID=344685
A google search for "spss surface plot" brings up an example using IGRAPH syntax from Raynald's site (I presume you could use that to convert to modern GGRAPH). There is an example of a 3d histogram in the GGRAPH manual. I haven't seen any paneled examples of 3d plots, so I can't say if it is possible (logically it should be given the grammer - but that doesn't necessarily mean it is). |
|
Administrator
|
Thanks Andy!
Looks like RTFM time for me ;-)
Please reply to the list and not to my personal email.
Those desiring my consulting or training services please feel free to email me. --- "Nolite dare sanctum canibus neque mittatis margaritas vestras ante porcos ne forte conculcent eas pedibus suis." Cum es damnatorum possederunt porcos iens ut salire off sanguinum cliff in abyssum?" |
|
In reply to this post by Andy W
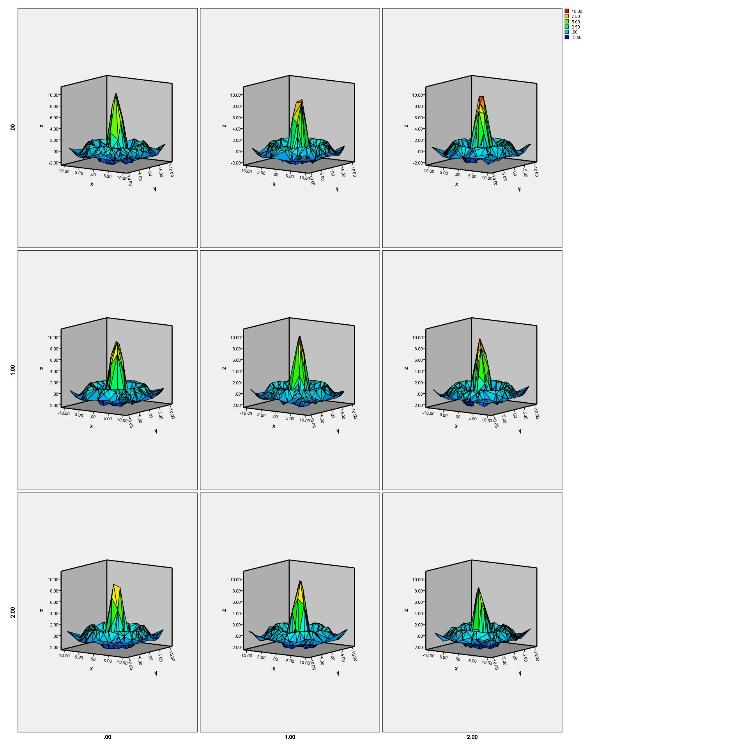
Extending the example on the SPSS Community
site for paneling just means adding another dimension to the ELEMENT algebra
- it's a grammar. For illustration purposes I just randomly divided
up the points.
I also used a PAGE statement to improve the shape. INPUT PROGRAM. LOOP id=0 TO 2499. END CASE. END LOOP. END FILE. END INPUT PROGRAM. EXE. FORMATS id (F8.0). compute #tmp1 = trunc(id/50). compute x = -10 +(20/49)* #tmp1. compute #tmp2 = mod(id, 50). compute y = -10 +(20/49)* (#tmp2). compute #tmp3 = (x**2+y**2)**0.5. compute z =10* sin(#tmp3)/#tmp3. compute random = trunc(rv.uniform(0,3)). dataset name hat. GGRAPH /GRAPHDATASET NAME="graphdataset" VARIABLES=x z y random /GRAPHSPEC SOURCE=INLINE. BEGIN GPL SOURCE: s=userSource(id("graphdataset")) PAGE: begin(scale(10.0in, 4.0in)) DATA: x=col(source(s), name("x")) DATA: z=col(source(s), name("z")) DATA: y=col(source(s), name("y")) DATA: random = col(source(s), name("random"), unit.category()) COORD: rect(dim(1,2,3)) GUIDE: axis(dim(1), label("y")) GUIDE: axis(dim(2), label("x")) GUIDE: axis(dim(3), label("z")) ELEMENT: line(position(y*x*z*random), color(z)) PAGE: end() END GPL. Jon Peck (no "h") aka Kim Senior Software Engineer, IBM [hidden email] phone: 720-342-5621 From: Andy W <[hidden email]> To: [hidden email], Date: 03/21/2013 04:49 PM Subject: Re: [SPSSX-L] 3 dim surface plots Sent by: "SPSSX(r) Discussion" <[hidden email]> See http://www.ibm.com/developerworks/forums/thread.jspa?threadID=344685 A google search for " spss surface plot <https://www.google.com/search?q=SPSS+surface+plot&aq=f&oq=SPSS+Surface+plot&aqs=chrome.0.59j60l2j62l3.4356&sourceid=chrome&ie=UTF-8> " brings up an example using IGRAPH syntax from Raynald's site (I presume you could use that to convert to modern GGRAPH). There is an example of a 3d histogram in the GGRAPH manual <http://www.unt.edu/rss/class/Jon/SPSS_SC/Manuals/v19/GPL%20Reference%20Guide%20for%20IBM%20SPSS%20Statistics.pdf> . I haven't seen any paneled examples of 3d plots, so I can't say if it is possible (logically it should be given the grammer - but that doesn't necessarily mean it is). ----- Andy W [hidden email] http://andrewpwheeler.wordpress.com/ -- View this message in context: http://spssx-discussion.1045642.n5.nabble.com/3-dim-surface-plots-tp5718953p5718954.html Sent from the SPSSX Discussion mailing list archive at Nabble.com. ===================== To manage your subscription to SPSSX-L, send a message to [hidden email] (not to SPSSX-L), with no body text except the command. To leave the list, send the command SIGNOFF SPSSX-L For a list of commands to manage subscriptions, send the command INFO REFCARD |
|
Administrator
|
Thank you Jon,
That should get me going. David
Please reply to the list and not to my personal email.
Those desiring my consulting or training services please feel free to email me. --- "Nolite dare sanctum canibus neque mittatis margaritas vestras ante porcos ne forte conculcent eas pedibus suis." Cum es damnatorum possederunt porcos iens ut salire off sanguinum cliff in abyssum?" |
|
Administrator
|
For those interested in 2D paneled 3D plots, here is a very slightly modified version of Jon's code.
One final (probably not ;-) Is there any way to get smoothing rather than the rough polygons? I have hi-lighted my differences. INPUT PROGRAM. LOOP id=0 TO 2499. END CASE. END LOOP. END FILE. END INPUT PROGRAM. EXE. FORMATS id (F8.0). compute #tmp1 = trunc(id/50). compute x = -10 +(20/49)* #tmp1. compute #tmp2 = mod(id, 50). compute y = -10 +(20/49)* (#tmp2). compute #tmp3 = (x**2+y**2)**0.5. compute z =10* sin(#tmp3)/#tmp3. compute random = trunc(rv.uniform(0,3)). compute random2 = trunc(rv.uniform(0,3)). dataset name hat. GGRAPH /GRAPHDATASET NAME="graphdataset" VARIABLES=x z y random random2 /GRAPHSPEC SOURCE=INLINE. BEGIN GPL SOURCE: s=userSource(id("graphdataset")) PAGE: begin(scale(20.0in, 20.0in)) DATA: x=col(source(s), name("x")) DATA: z=col(source(s), name("z")) DATA: y=col(source(s), name("y")) DATA: random = col(source(s), name("random"), unit.category()) DATA: random2 = col(source(s), name("random2"), unit.category()) COORD: rect(dim(1,2,3)) GUIDE: axis(dim(1), label("y")) GUIDE: axis(dim(2), label("x")) GUIDE: axis(dim(3), label("z")) ELEMENT: line(position(y*x*z*random*random2), color(z)) PAGE: end() END GPL. 
Please reply to the list and not to my personal email.
Those desiring my consulting or training services please feel free to email me. --- "Nolite dare sanctum canibus neque mittatis margaritas vestras ante porcos ne forte conculcent eas pedibus suis." Cum es damnatorum possederunt porcos iens ut salire off sanguinum cliff in abyssum?" |
|
Check out the "smooth." functions in the GGRAPH manual. I'm on V15 at my work, so it is more limited than the current versions (e.g. your PAGE statements to control the height and width of the plot don't work in my version).
I tried this (with the 1 dimensional plot - not the small multiple plots) and my session of SPSS is currently frozen, perhaps you will have better luck with a newer version. *******************************************************. GGRAPH /GRAPHDATASET NAME="graphdataset" VARIABLES=x z y MISSING=LISTWISE REPORTMISSING=NO /GRAPHSPEC SOURCE=INLINE. BEGIN GPL SOURCE: s=userSource(id("graphdataset")) DATA: x=col(source(s), name("x")) DATA: z=col(source(s), name("z")) DATA: y=col(source(s), name("y")) COORD: rect(dim(1,2,3)) GUIDE: axis(dim(1), label("y")) GUIDE: axis(dim(2), label("x")) GUIDE: axis(dim(3), label("z")) ELEMENT: line(position(smooth.spline(y*x*z)), color(z)) END GPL. *******************************************************. |
|
smooth.linear, smooth.quadratic, smooth,cubic,
smooth.mean, smooth.median, smooth.spline, smooth.step
Jon Peck (no "h") aka Kim Senior Software Engineer, IBM [hidden email] phone: 720-342-5621 From: Andy W <[hidden email]> To: [hidden email], Date: 03/22/2013 06:33 AM Subject: Re: [SPSSX-L] 3 dim surface plots Sent by: "SPSSX(r) Discussion" <[hidden email]> Check out the "smooth." functions in the GGRAPH manual. I'm on V15 at my work, so it is more limited than the current versions (e.g. your PAGE statements to control the height and width of the plot don't work in my version). I tried this (with the 1 dimensional plot - not the small multiple plots) and my session of SPSS is currently frozen, perhaps you will have better luck with a newer version. *******************************************************. GGRAPH /GRAPHDATASET NAME="graphdataset" VARIABLES=x z y MISSING=LISTWISE REPORTMISSING=NO /GRAPHSPEC SOURCE=INLINE. BEGIN GPL SOURCE: s=userSource(id("graphdataset")) DATA: x=col(source(s), name("x")) DATA: z=col(source(s), name("z")) DATA: y=col(source(s), name("y")) COORD: rect(dim(1,2,3)) GUIDE: axis(dim(1), label("y")) GUIDE: axis(dim(2), label("x")) GUIDE: axis(dim(3), label("z")) ELEMENT: line(position(smooth.spline(y*x*z)), color(z)) END GPL. *******************************************************. ----- Andy W [hidden email] http://andrewpwheeler.wordpress.com/ -- View this message in context: http://spssx-discussion.1045642.n5.nabble.com/3-dim-surface-plots-tp5718953p5718967.html Sent from the SPSSX Discussion mailing list archive at Nabble.com. ===================== To manage your subscription to SPSSX-L, send a message to [hidden email] (not to SPSSX-L), with no body text except the command. To leave the list, send the command SIGNOFF SPSSX-L For a list of commands to manage subscriptions, send the command INFO REFCARD |
|
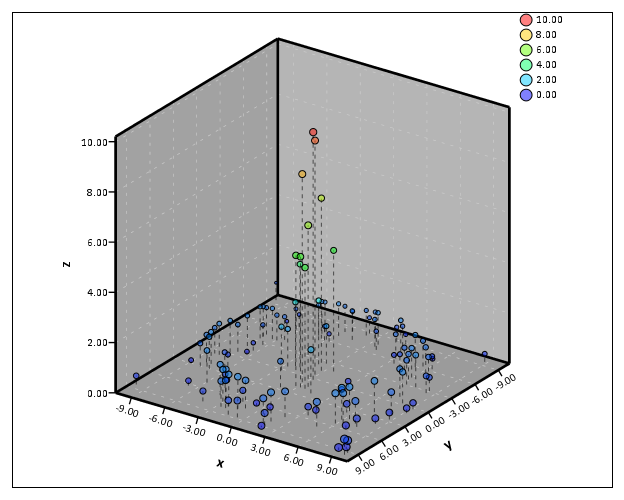
While we are on the subject, another cool way to represent 3d (or 2.5d) surface data like this when the sampling isn't so regular (so interpolation over surface plots doesn't look as nice), is to anchor the points to the floor with either an interval or an edge element. Here I use an edge element to make the dashed pattern, and some post-hoc editing in the output viewer results in the chart attached.
I believe I got this idea from the behavior of Mathematica. If you check it out with the full data (with values below zero) the lines end up looking like pin art (actually if you just use points instead of surface lines the shape of the function is readily apparent as well). *******************************************************. INPUT PROGRAM. LOOP id=0 TO 2499. END CASE. END LOOP. END FILE. END INPUT PROGRAM. EXE. FORMATS id (F8.0). compute #tmp1 = trunc(id/50). compute x = -10 +(20/49)* #tmp1. compute #tmp2 = mod(id, 50). compute y = -10 +(20/49)* (#tmp2). compute #tmp3 = (x**2+y**2)**0.5. compute z =10* sin(#tmp3)/#tmp3. exe. sample 300 from 2499. temporary. select if z >= 0. GGRAPH /GRAPHDATASET NAME="graphdataset" VARIABLES=x z y MISSING=LISTWISE REPORTMISSING=NO /GRAPHSPEC SOURCE=INLINE. BEGIN GPL SOURCE: s=userSource(id("graphdataset")) DATA: x=col(source(s), name("x")) DATA: z=col(source(s), name("z")) DATA: y=col(source(s), name("y")) TRANS: base=eval(0) COORD: rect(dim(1,2,3)) GUIDE: axis(dim(1), label("y")) GUIDE: axis(dim(2), label("x")) GUIDE: axis(dim(3), label("z")) ELEMENT: edge(position(y*x*(base + z)), transparency.interior(transparency."0.4"), shape(shape.dash)) ELEMENT: point(position(y*x*z), transparency.exterior(transparency."0.5"), color.interior(z), transparency.interior(transparency."0.5")) END GPL. *******************************************************. 
|
|
Administrator
|
In reply to this post by Andy W
"my session of SPSS is currently frozen"
Ditto ;-( --
Please reply to the list and not to my personal email.
Those desiring my consulting or training services please feel free to email me. --- "Nolite dare sanctum canibus neque mittatis margaritas vestras ante porcos ne forte conculcent eas pedibus suis." Cum es damnatorum possederunt porcos iens ut salire off sanguinum cliff in abyssum?" |
Automatic reply: 3 dim surface plots
|
Greetings,
Thank you for your message. I will be out of the office Friday, March 22 and will return on Monday, March 25th, and will respond to your email at that time. Regards, Pat Estes Assessment Analyst Office of Institutional Assessment and Research Edgewood College ===================== To manage your subscription to SPSSX-L, send a message to [hidden email] (not to SPSSX-L), with no body text except the command. To leave the list, send the command SIGNOFF SPSSX-L For a list of commands to manage subscriptions, send the command INFO REFCARD |
|
Administrator
|
In reply to this post by Andy W
Thanks Andy!
That might prove to be useful too. I feel like a kid in a candy store!
Please reply to the list and not to my personal email.
Those desiring my consulting or training services please feel free to email me. --- "Nolite dare sanctum canibus neque mittatis margaritas vestras ante porcos ne forte conculcent eas pedibus suis." Cum es damnatorum possederunt porcos iens ut salire off sanguinum cliff in abyssum?" |
|
Yes they are quite fun, and post back some examples to the list if you can get some of the smoothing functions to work with the surface plots.
The more you work with it you will find out that the GGRAPH manual does not do the system justice, and the examples section could be extended quite a bit, this being but one example. (Of course the varieties are infinite, but most of the examples are things you can do in any program that makes stat graphs, there are many (that should be used more often) that you can really only do easily in a few statistical packages). |
|
By the GGRAPH manual I think you mean the
combination of GGRAPH in the CSR and the complete but all-to-terse GPL
section of the Help system. For a start, for the benefit of people
not familiar with this, use the ChartBuilder. It will generate all
the boilerplate stuff, and it will illustrate a lot of features of GPL.
Also, you can use the Chart Editor to tweak a chart and save it as
a template.
If you really want to get deeply into this, study the ViZml section in the help. That's the assembly language of the graphics engine, and you can feed your own ViZml to GGRAPH if you are brave. Jon Peck (no "h") aka Kim Senior Software Engineer, IBM [hidden email] phone: 720-342-5621 From: Andy W <[hidden email]> To: [hidden email], Date: 03/22/2013 11:07 AM Subject: Re: [SPSSX-L] 3 dim surface plots Sent by: "SPSSX(r) Discussion" <[hidden email]> Yes they are quite fun, and post back some examples to the list if you can get some of the smoothing functions to work with the surface plots. The more you work with it you will find out that the GGRAPH manual does not do the system justice, and the examples section could be extended quite a bit, this being but one example. (Of course the varieties are infinite, but most of the examples are things you can do in any program that makes stat graphs, there are many (that should be used more often) that you can really only do easily in a few statistical packages). ----- Andy W [hidden email] http://andrewpwheeler.wordpress.com/ -- View this message in context: http://spssx-discussion.1045642.n5.nabble.com/3-dim-surface-plots-tp5718953p5718979.html Sent from the SPSSX Discussion mailing list archive at Nabble.com. ===================== To manage your subscription to SPSSX-L, send a message to [hidden email] (not to SPSSX-L), with no body text except the command. To leave the list, send the command SIGNOFF SPSSX-L For a list of commands to manage subscriptions, send the command INFO REFCARD |
|
Administrator
|
"If you really want to get deeply into this, study the ViZml section in the
help. That's the assembly language of the graphics engine, and you can feed your own ViZml to GGRAPH if you are brave." LOL: When I first picked up Visual Basic around 1996, one of the first books I bought was Dan Appleman's book "Visual Basic Programmer's Guide to the Windows API" http://www.amazon.com/Applemans-Visual-Basic-Programmers-Guide/dp/0672315904/ref=sr_1_2?ie=UTF8&qid=1363973521&sr=8-2&keywords=appleman+dan Then I completely fried my brain when I got my mitts on Bruce McKinney's Hard Core Visual Basic. Brave? I'm bloody fearless! Might have to defer this adventure until after I nail the essentials for some current projects and have time to go full bore brainiac into the core. ------------------------------------------
Please reply to the list and not to my personal email.
Those desiring my consulting or training services please feel free to email me. --- "Nolite dare sanctum canibus neque mittatis margaritas vestras ante porcos ne forte conculcent eas pedibus suis." Cum es damnatorum possederunt porcos iens ut salire off sanguinum cliff in abyssum?" |
«
Return to SPSSX Discussion
|
1 view|%1 views
| Free forum by Nabble | Edit this page |


