Can't view Statistics from GENLIMMIXED
Can't view Statistics from GENLIMMIXED
|
Hi Guys,
So Im trying to run a gen linear mixed model and after spending hours working out how to organise my data correctly (im very new to SPSS) I can't find the statistics, I only have the model viewer looking something like this  I need the test statisitcs to report in my paper, Is there something obvious I need to do? I find it really weird that there isn't a p-value table displayed.. Any help would be greatly appreciated.. Also sorry for what is probably a very dumb question.. I've been asking google for ages with no luck Cheers Sam |
Re: Can't view Statistics from GENLIMMIXED
|
Sorry to be pushy, but any help on this would be really appreciated.. I have a deadline next week to submit for publication..
Thanks in advance Sam |
|
You have provided no information regarding your data, design, analysis, or hypotheses. So, it's nearly impossible to help you in any great detail.
I will make a couple of points: 1. If you double click on the viewer you will have the option of seeing in a diagram and/or table format various key pieces of info (eg fit stats, fixed effect solutions, standard errors, p-values, variance components etc.) 2. You have received a warning that some values of your DV are not non-negative integers. Do you understand why that poses a problem for the model you have specified? If not, I suggest you hold off on submitting for publication and seek statistical consultation. Ryan > On Aug 4, 2014, at 1:43 PM, Samatthews12 <[hidden email]> wrote: > > Sorry to be pushy, but any help on this would be really appreciated.. I have > a deadline next week to submit for publication.. > > Thanks in advance > > Sam > > > > -- > View this message in context: http://spssx-discussion.1045642.n5.nabble.com/Can-t-view-Statistics-from-GENLIMMIXED-tp5726878p5726881.html > Sent from the SPSSX Discussion mailing list archive at Nabble.com. > > ===================== > To manage your subscription to SPSSX-L, send a message to > [hidden email] (not to SPSSX-L), with no body text except the > command. To leave the list, send the command > SIGNOFF SPSSX-L > For a list of commands to manage subscriptions, send the command > INFO REFCARD ===================== To manage your subscription to SPSSX-L, send a message to [hidden email] (not to SPSSX-L), with no body text except the command. To leave the list, send the command SIGNOFF SPSSX-L For a list of commands to manage subscriptions, send the command INFO REFCARD |
Re: Can't view Statistics from GENLIMMIXED
|
Thanks for your response Ryan,
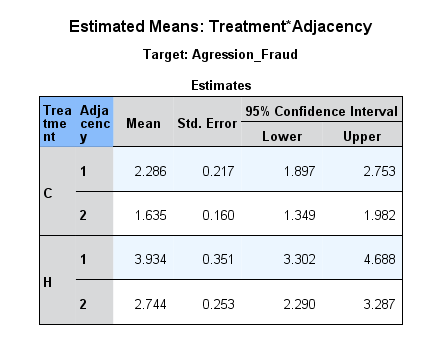
I have sorted the non-negative integers problem. My model is really quite complex so I didn't want to bore anyone with it.. Basically I had 20 tanks of fish each with 5 individuals (n=100) 10 tanks were under elevated heat, 10 were held at control temperature (treatment factor) Aggression (basic count data of aggressive displays) was measured between individuals at four separate occasions (Time) we also compared whether aggression was between of similar sizes or dissimilar sizes (factor is called Adjacency).. So my data looks like this. My understanding is that I should build the model with FIsh_ID and Tank_ID as random factors and both Adjacency and Time as repeated measures (because in total I have 8 measurements from each individual)  My count data is from the poisson distribution but with quite a lot of variation so the negative binomial regression is used. In the model I want to see the effect of time, adjacency and treamtent on aggression (as well as the interactions). The real problem Im having is that I can't find a table with all the p-values, std err etc in the model viewer. I get graphs for the significant factors.. The factors that I asked the model to estimate means gives me a table (below) but this only gives confidence interval with no significance tests. Is there something im missing in the model options where I maybe have to tell SPSS to give me p-values?..  Thank you again for your help I truly appreciate it.. At the moment I'm volunteering in greece and not around any stats gurus so I'm kind of stuck for help. Thanks again Cheers |
Re: Can't view Statistics from GENLIMMIXED
|
Select Tables from the Styles dropdown:
http://www-01.ibm.com/support/knowledgecenter/SSLVMB_22.0.0/com.ibm.spss.statistics.help/components/glmm/idh_glmm_fixed_coefficients.htm Alex From: Samatthews12 <[hidden email]> To: [hidden email] Date: 08/05/2014 06:53 AM Subject: Re: Can't view Statistics from GENLIMMIXED Sent by: "SPSSX(r) Discussion" <[hidden email]> The real problem Im having is that I can't find a table with all the p-values, std err etc in the model viewer. I get graphs for the significant factors.. ===================== To manage your subscription to SPSSX-L, send a message to [hidden email] (not to SPSSX-L), with no body text except the command. To leave the list, send the command SIGNOFF SPSSX-L For a list of commands to manage subscriptions, send the command INFO REFCARD |
Re: Can't view Statistics from GENLIMMIXED
|
Thanks Alex..
I appreciate your help.. I knew it was something incredibly easy! Muchas Gracias |
«
Return to SPSSX Discussion
|
1 view|%1 views
| Free forum by Nabble | Edit this page |

