Collapsing multiple records by unique ID


|
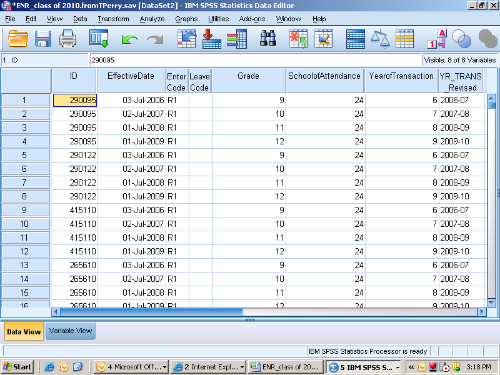
I now have a file where each ID may have multiple records, and I need to create a file with one record for each ID. Below I have pasted a screenshot with a sample of the data.
 Any help with this would be greatly appreciated! I have attempted to use the aggregate function unsuccessfully as several of the variables are string variables. RJ Bangurah Research Scientist |
Re: Collapsing multiple records by unique ID
|
Administrator
|
What do you want the file to look like when it has one row per ID? Take GRADE, for example. At the moment, there are multiple values for each ID. Do you want to preserve those raw values (e.g., in multiple columns)? Or do you want one mean grade for each ID? Please provide more details.
--
Bruce Weaver bweaver@lakeheadu.ca http://sites.google.com/a/lakeheadu.ca/bweaver/ "When all else fails, RTFM." PLEASE NOTE THE FOLLOWING: 1. My Hotmail account is not monitored regularly. To send me an e-mail, please use the address shown above. 2. The SPSSX Discussion forum on Nabble is no longer linked to the SPSSX-L listserv administered by UGA (https://listserv.uga.edu/). |

|
|
Sorry. For each ID, I need to preserve the multiple values
for a variable in separate columns. So using grade as an
example, I would need fields for grade 1, grade2, …gradex for each ID.
The highest number of entries for an ID is 33. I have tried running the
syntax pasted below as well as converting cases to variables, but did not get what
I have described. SORT CASES BY ID. EXECUTE. COMPUTE tasknum=1. DO IF ($CASENUM NE 1). IF (id EQ LAG(ID)) tasknum = LAG(tasknum)+1. END IF. EXECUTE. DO REPEAT trial=EffectiveDate to YR_TRANS_Revised. VECTOR trial(33). COMPUTE trial(tasknum)=trial. END REPEAT. AGGREGATE OUTFILE=* /BREAK=ID /EffectiveDate1= MAX(EffectiveDate1) /EffectiveDate2= MAX(EffectiveDate2) /EffectiveDate3= MAX(EffectiveDate3) /EffectiveDate4= MAX(EffectiveDate4) /EffectiveDate5= MAX(EffectiveDate5) //EffectiveDate6= MAX(EffectiveDate6) /EffectiveDate7= MAX(EffectiveDate7) /EffectiveDate8= MAX(EffectiveDate8) /EffectiveDate9= MAX(EffectiveDate9) /EffectiveDate10= MAX(EffectiveDate10) /EffectiveDate11= MAX(EffectiveDate11) /EffectiveDate12= MAX(EffectiveDate12) /EffectiveDate13= MAX(EffectiveDate13) /EffectiveDate14= MAX(EffectiveDate14) /EffectiveDate15= MAX(EffectiveDate15) /EffectiveDate16= MAX(EffectiveDate16) /EffectiveDate17= MAX(EffectiveDate17) /EffectiveDate18= MAX(EffectiveDate18) /EffectiveDate19= MAX(EffectiveDate19) /EffectiveDate20= MAX(EffectiveDate20) /EffectiveDate21= MAX(EffectiveDate21) /EffectiveDate22= MAX(EffectiveDate22) /EffectiveDate23= MAX(EffectiveDate23) /EffectiveDate24= MAX(EffectiveDate24) /EffectiveDate25= MAX(EffectiveDate25) /EffectiveDate26= MAX(EffectiveDate26) /EffectiveDate27= MAX(EffectiveDate27) /EffectiveDate28= MAX(EffectiveDate28) /EffectiveDate29= MAX(EffectiveDate29) /EffectiveDate30= MAX(EffectiveDate30) /EffectiveDate31= MAX(EffectiveDate31) /EffectiveDate32= MAX(EffectiveDate32) /EffectiveDate33= MAX(EffectiveDate33) /EnterCode1= MAX(EnterCode1) /EnterCode2= MAX(EnterCode2) /EnterCode3= MAX(EnterCode3) /EnterCode4= MAX(EnterCode4) /EnterCode5= MAX(EnterCode5) /EnterCode6= MAX(EnterCode6) /EnterCode7= MAX(EnterCode7) /EnterCode8= MAX(EnterCode8) /EnterCode9= MAX(EnterCode9) /EnterCode10= MAX(EnterCode10) /EnterCode11= MAX(EnterCode11) /EnterCode12= MAX(EnterCode12) /EnterCode13= MAX(EnterCode13) /EnterCode14= MAX(EnterCode14) /EnterCode15= MAX(EnterCode15) /EnterCode16= MAX(EnterCode16) /EnterCode17= MAX(EnterCode17) /EnterCode18= MAX(EnterCode18) /EnterCode19= MAX(EnterCode19) /EnterCode20= MAX(EnterCode20) /EnterCode21= MAX(EnterCode21) /EnterCode22= MAX(EnterCode22) /EnterCode23= MAX(EnterCode23) /EnterCode24= MAX(EnterCode24) /EnterCode25= MAX(EnterCode25) /EnterCode26= MAX(EnterCode26) /EnterCode27= MAX(EnterCode27) /EnterCode28= MAX(EnterCode28) /EnterCode29= MAX(EnterCode29) /EnterCode30= MAX(EnterCode30) /EnterCode31= MAX(EnterCode31) /EnterCode32= MAX(EnterCode32) /EnterCode33= MAX(EnterCode33) /LeaveCode1= MAX(LeaveCode1) /LeaveCode2= MAX(LeaveCode2) /LeaveCode3= MAX(LeaveCode3) /LeaveCode4= MAX(LeaveCode4) /LeaveCode5= MAX(LeaveCode5) /LeaveCode6= MAX(LeaveCode6) /LeaveCode7= MAX(LeaveCode7) /LeaveCode8= MAX(LeaveCode8) /LeaveCode9= MAX(LeaveCode9) /LeaveCode10= MAX(LeaveCode10) /LeaveCode11= MAX(LeaveCode11) /LeaveCode12= MAX(LeaveCode12) /LeaveCode13= MAX(LeaveCode13) /LeaveCode14= MAX(LeaveCode14) /LeaveCode15= MAX(LeaveCode15) /LeaveCode16= MAX(LeaveCode16) /LeaveCode17= MAX(LeaveCode17) /LeaveCode18= MAX(LeaveCode18) /LeaveCode19= MAX(LeaveCode19) /LeaveCode20= MAX(LeaveCode20) /LeaveCode21= MAX(LeaveCode21) /LeaveCode22= MAX(LeaveCode22) /LeaveCode23= MAX(LeaveCode23) /LeaveCode24= MAX(LeaveCode24) /LeaveCode25= MAX(LeaveCode25) /LeaveCode26= MAX(LeaveCode26) /LeaveCode27= MAX(LeaveCode27) /LeaveCode28= MAX(LeaveCode28) /LeaveCode29= MAX(LeaveCode29) /LeaveCode30= MAX(LeaveCode30) /LeaveCode31= MAX(LeaveCode31) /LeaveCode32= MAX(LeaveCode32) /LeaveCode33= MAX(LeaveCode33) /Grade1= MAX(Grade1) /Grade2= MAX(Grade2) /Grade3= MAX(Grade3) /Grade4= MAX(Grade4) /Grade5= MAX(Grade5) /Grade6= MAX(Grade6) /Grade7= MAX(Grade7) /Grade8= MAX(Grade8) /Grade9= MAX(Grade9) /Grade10= MAX(Grade10) /Grade11= MAX(Grade11) /Grade12= MAX(Grade12) /Grade13= MAX(Grade13) /Grade14= MAX(Grade14) /Grade15= MAX(Grade15) /Grade16= MAX(Grade16) /Grade17= MAX(Grad17) /Grade18= MAX(Grade18) /Grade19= MAX(Grade19) /Grade20= MAX(Grade20) /Grade21= MAX(Grade21) /Grade22= MAX(Grade22) /Grade23= MAX(Grade23) /Grade24= MAX(Grade24) /Grade25= MAX(Grade25) /Grade26= MAX(Grade26) /Grade27= MAX(Grade27) /Grade28= MAX(Grade28) /Grade29= MAX(Grade29) /Grade30= MAX(Grade30) /Grade31= MAX(Grade31) /Grade32= MAX(Grade32) /Grade33= MAX(Grade33) /SchoolofAttendance1= MAX(SchoolofAttendance1) /SchoolofAttendance2= MAX(SchoolofAttendance2) /SchoolofAttendance3= MAX(SchoolofAttendance3) /SchoolofAttendance4= MAX(SchoolofAttendance4) /SchoolofAttendance5= MAX(SchoolofAttendance5) /SchoolofAttendance6= MAX(SchoolofAttendance6) /SchoolofAttendance7= MAX(SchoolofAttendance7) /SchoolofAttendance8= MAX(SchoolofAttendance8) /SchoolofAttendance9= MAX(SchoolofAttendance9) /SchoolofAttendance10= MAX(SchoolofAttendance10) /SchoolofAttendance11= MAX(SchoolofAttendance11) /SchoolofAttendance12= MAX(SchoolofAttendance12) /SchoolofAttendance13= MAX(SchoolofAttendance13) /SchoolofAttendance14= MAX(SchoolofAttendance14) /SchoolofAttendance15= MAX(SchoolofAttendance15) /SchoolofAttendance16= MAX(SchoolofAttendance16) /SchoolofAttendance17= MAX(SchoolofAttendance17) /SchoolofAttendance18= MAX(SchoolofAttendance18) /SchoolofAttendance19= MAX(SchoolofAttendance19) /SchoolofAttendance20= MAX(SchoolofAttendance20) /SchoolofAttendance21= MAX(SchoolofAttendance21) /SchoolofAttendance22= MAX(SchoolofAttendance22) /SchoolofAttendance23= MAX(SchoolofAttendance23) /SchoolofAttendance24= MAX(SchoolofAttendance24) /SchoolofAttendance25= MAX(SchoolofAttendance25) /SchoolofAttendance26= MAX(SchoolofAttendance26) /SchoolofAttendance27= MAX(SchoolofAttendance27) /SchoolofAttendance28= MAX(SchoolofAttendance28) /SchoolofAttendance29= MAX(SchoolofAttendance29) /SchoolofAttendance30= MAX(SchoolofAttendance30) /SchoolofAttendance31= MAX(SchoolofAttendance31) /SchoolofAttendance32= MAX(SchoolofAttendance32) /SchoolofAttendance33= MAX(SchoolofAttendance33) /YearofTransaction1= MAX(YearofTransaction1) /YearofTransaction2= MAX(YearofTransaction2) /YearofTransaction3= MAX(YearofTransaction3) /YearofTransaction4= MAX(YearofTransaction4) /YearofTransaction5= MAX(YearofTransaction5) /YearofTransaction6= MAX(YearofTransaction6) /YearofTransaction7= MAX(YearofTransaction7) /YearofTransaction8= MAX(YearofTransaction8) /YearofTransaction9= MAX(YearofTransaction9) /YearofTransaction10= MAX(YearofTransaction10) /YearofTransaction11= MAX(YearofTransaction11) /YearofTransaction12= MAX(YearofTransaction12) /YearofTransaction13= MAX(YearofTransaction13) /YearofTransaction14= MAX(YearofTransaction14) /YearofTransaction15= MAX(YearofTransaction15) /YearofTransaction16= MAX(YearofTransaction16) /YearofTransaction17= MAX(YearofTransaction17) /YearofTransaction18= MAX(YearofTransaction18) /YearofTransaction19= MAX(YearofTransaction19) /YearofTransaction20= MAX(YearofTransaction20) /YearofTransaction21= MAX(YearofTransaction21) /YearofTransaction22= MAX(YearofTransaction22) /YearofTransaction23= MAX(YearofTransaction23) /YearofTransaction24= MAX(YearofTransaction24) /YearofTransaction25= MAX(YearofTransaction25) /YearofTransaction26= MAX(YearofTransaction26) /YearofTransaction27= MAX(YearofTransaction27) /YearofTransaction28= MAX(YearofTransaction28) /YearofTransaction29= MAX(YearofTransaction29) /YearofTransaction30= MAX(YearofTransaction30) /YearofTransaction31= MAX(YearofTransaction31) /YearofTransaction32= MAX(YearofTransaction32) /YearofTransaction33= MAX(YearofTransaction33) /YR_TRANS_Revised1= MAX(YR_TRANS_Revised1) /YR_TRANS_Revised2= MAX(YR_TRANS_Revised2) /YR_TRANS_Revised3= MAX(YR_TRANS_Revised3) /YR_TRANS_Revised4= MAX(YR_TRANS_Revised4) /YR_TRANS_Revised5= MAX(YR_TRANS_Revised5) /YR_TRANS_Revised6= MAX(YR_TRANS_Revised6) /YR_TRANS_Revised7= MAX(YR_TRANS_Revised7) /YR_TRANS_Revised8= MAX(YR_TRANS_Revised8) /YR_TRANS_Revised9= MAX(YR_TRANS_Revised9) /YR_TRANS_Revised10= MAX(YR_TRANS_Revised10) /YR_TRANS_Revised11= MAX(YR_TRANS_Revised11) /YR_TRANS_Revised12= MAX(YR_TRANS_Revised12) /YR_TRANS_Revised13= MAX(YR_TRANS_Revised13) /YR_TRANS_Revised14= MAX(YR_TRANS_Revised14) /YR_TRANS_Revised15= MAX(YR_TRANS_Revised15) /YR_TRANS_Revised16= MAX(YR_TRANS_Revised16) /YR_TRANS_Revised17= MAX(YR_TRANS_Revised17) /YR_TRANS_Revised18= MAX(YR_TRANS_Revised18) /YR_TRANS_Revised19= MAX(YR_TRANS_Revised19) /YR_TRANS_Revised20= MAX(YR_TRANS_Revised20) /YR_TRANS_Revised21= MAX(YR_TRANS_Revised21) /YR_TRANS_Revised22= MAX(YR_TRANS_Revised22) /YR_TRANS_Revised23= MAX(YR_TRANS_Revised23) /YR_TRANS_Revised24= MAX(YR_TRANS_Revised24) /YR_TRANS_Revised25= MAX(YR_TRANS_Revised25) /YR_TRANS_Revised26= MAX(YR_TRANS_Revised26) /YR_TRANS_Revised27= MAX(YR_TRANS_Revised27) /YR_TRANS_Revised28= MAX(YR_TRANS_Revised28) /YR_TRANS_Revised29= MAX(YR_TRANS_Revised29) /YR_TRANS_Revised30= MAX(YR_TRANS_Revised30) /YR_TRANS_Revised31= MAX(YR_TRANS_Revised31) /YR_TRANS_Revised32= MAX(YR_TRANS_Revised32) /YR_TRANS_Revised33= MAX(YR_TRANS_Revised33). EXECUTE. LIST. From: Bruce Weaver [via
SPSSX Discussion] [mailto:[hidden email]]
What do you want the file to
look like when it has one row per ID? Take GRADE, for example. At
the moment, there are multiple values for each ID. Do you want to
preserve those raw values (e.g., in multiple columns)? Or do you want one
mean grade for each ID? Please provide more details. -- View message @ http://spssx-discussion.1045642.n5.nabble.com/Collapsing-multiple-records-by-unique-ID-tp3245589p3245631.html
|

RE: Collapsing multiple records by unique ID - Number of numbers in MIME From exceeds maximum threshold - Number of numbers in MIME From exceeds maximum threshold
|
Administrator
|
Look up CASESTOVARS in the Help files. There are also tutorials online, such as this one: http://www.ats.ucla.edu/stat/spss/modules/reshapew115.htm
--
Bruce Weaver bweaver@lakeheadu.ca http://sites.google.com/a/lakeheadu.ca/bweaver/ "When all else fails, RTFM." PLEASE NOTE THE FOLLOWING: 1. My Hotmail account is not monitored regularly. To send me an e-mail, please use the address shown above. 2. The SPSSX Discussion forum on Nabble is no longer linked to the SPSSX-L listserv administered by UGA (https://listserv.uga.edu/). |
Re: Collapsing multiple records by unique ID
|
|
In reply to this post by rjackson
At 04:48 PM 11/1/2010, rjackson wrote:
>For each ID, I need to preserve the multiple >values for a variable in separate columns. So >using grade as an example, I would need fields >for grade 1, grade2, gradex for each ID. The >highest number of entries for an ID is 33. As Bruce Weaver wrote, CASESTOVARS should do this for you fairly easily. When I need this kind of code, I usually use the menus (Data>Restructure...), paste the result, and edit it if necessary. Try it, and post again if you have trouble. However, you should also think about whether you want to collapse the data this way. You don't say what your needs are, but in SPSS many data manipulations, and many analyses, are easier to carry out with data in the 'long' form as you have it now, rather than the 'wide' form you're trying to get. ===================== To manage your subscription to SPSSX-L, send a message to [hidden email] (not to SPSSX-L), with no body text except the command. To leave the list, send the command SIGNOFF SPSSX-L For a list of commands to manage subscriptions, send the command INFO REFCARD |
|
|
Hi List, I was wondering if someone could provide me some suggestions. I want to compare the scores of different logisitic regression (acquisition) models for different products, and based on the scores be able to select which product to mail to a prospect. I know that comparing raw scores would not be accurate. If the scores are normalized for each of the models would the comparison of scores still make sense to select which product offer to mail. Is there any other method? Pls let me know if it's not clear. Thank you. Renji Abraham |
|
|
I would use the regression coefficients to compute the
predicted probability of people with different characteristics choosing product
X.
For example, the predicted probability for choosing
product X will likely be different for females between 20-30 years versus males
between 60-70 years old. You can base which product to mail based on some groups
of characteristics.
From: SPSSX(r) Discussion [mailto:[hidden email]] On Behalf Of <R. Abraham> Sent: Thursday, November 04, 2010 10:56 AM To: [hidden email] Subject: Comparing Models Hi List, I was wondering if someone could provide me some suggestions. I want to compare the scores of different logisitic regression (acquisition) models for different products, and based on the scores be able to select which product to mail to a prospect. I know that comparing raw scores would not be accurate. If the scores are normalized for each of the models would the comparison of scores still make sense to select which product offer to mail. Is there any other method? Pls let me know if it's not clear. Thank you. Renji Abraham |
|
|
Thanks for the reply. I am actually looking to see which product to mail to a prospect. For example, There are three Products A, B & C. All three are totally different products. I build separate acquisition models (A, B, C) for each of the products. Say for Prospect 'X', the predicted probability scores for the 3 products are as follows: Model A --- 0.65426 Model B --- 0.75123 Model C --- 0.55458 If we were to compare the scores above, it would seem that we should mail product B to the prospect. But that wouldn't be accurate 'coz the predicted probability score is relative to the other prospects in the same population for that particular model. So my question is there a method to make the scores across the different models to be in the same scale? So that I can say although the raw predicted probability score is higher in Model B, the prospect 'X' is actually more likely to purchase product A. Again I hope I am being clear. Thank you. Renji Abraham
I would use the regression coefficients to compute the predicted probability of people with different characteristics choosing product X. For example, the predicted probability for choosing product X will likely be different for females between 20-30 years versus males between 60-70 years old. You can base which product to mail based on some groups of characteristics. From: SPSSX(r) Discussion [mailto:[hidden email]] On Behalf Of <R. Abraham> Sent: Thursday, November 04, 2010 10:56 AM To: [hidden email] Subject: Comparing Models Hi List, I was wondering if someone could provide me some suggestions. I want to compare the scores of different logisitic regression (acquisition) models for different products, and based on the scores be able to select which product to mail to a prospect. I know that comparing raw scores would not be accurate. If the scores are normalized for each of the models would the comparison of scores still make sense to select which product offer to mail. Is there any other method? Pls let me know if it's not clear. Thank you. Renji Abraham |
|
|
Why are you approaching the question this way? Typically, predictive marketing models like this are based on market-basket analysis or association models. These models need a lot of data and are usually built from a training set. The actual implementations of models of this type are highly proprietary and valued quite highly. Netflix had a competition offering the best predictor $Millions (?) if they could beat the Netflix internal model. SPSS Inc. has a variety of advanced predictive marketing tools which include association models. From: SPSSX(r) Discussion [mailto:[hidden email]] On Behalf Of <R. Abraham>
From: SPSSX(r) Discussion [mailto:[hidden email]] On Behalf Of <R. Abraham> |
|
|
My understanding is that the market-basket analysis helps to identify what combination of products to offer. But what I am trying to find is what one product to offer among a group of products that the prospect is more likely to purchase.
Why are you approaching the question this way? Typically, predictive marketing models like this are based on market-basket analysis or association models. These models need a lot of data and are usually built from a training set. The actual implementations of models of this type are highly proprietary and valued quite highly. Netflix had a competition offering the best predictor $Millions (?) if they could beat the Netflix internal model. SPSS Inc. has a variety of advanced predictive marketing tools which include association models. From: SPSSX(r) Discussion [mailto:[hidden email]] On Behalf Of <R. Abraham> Sent: Friday, November 05, 2010 7:56 AM To: [hidden email] Subject: Re: Comparing Models Thanks for the reply. I am actually looking to see which product to mail to a prospect. For example, There are three Products A, B & C. All three are totally different products. I build separate acquisition models (A, B, C) for each of the products. Say for Prospect 'X', the predicted probability scores for the 3 products are as follows: Model A --- 0.65426 Model B --- 0.75123 Model C --- 0.55458 If we were to compare the scores above, it would seem that we should mail product B to the prospect. But that wouldn't be accurate 'coz the predicted probability score is relative to the other prospects in the same population for that particular model. So my question is there a method to make the scores across the different models to be in the same scale? So that I can say although the raw predicted probability score is higher in Model B, the prospect 'X' is actually more likely to purchase product A. Again I hope I am being clear. Thank you. Renji Abraham
I would use the regression coefficients to compute the predicted probability of people with different characteristics choosing product X. For example, the predicted probability for choosing product X will likely be different for females between 20-30 years versus males between 60-70 years old. You can base which product to mail based on some groups of characteristics. From: SPSSX(r) Discussion [mailto:[hidden email]] On Behalf Of <R. Abraham> Sent: Thursday, November 04, 2010 10:56 AM To: [hidden email] Subject: Comparing Models Hi List, I was wondering if someone could provide me some suggestions. I want to compare the scores of different logisitic regression (acquisition) models for different products, and based on the scores be able to select which product to mail to a prospect. I know that comparing raw scores would not be accurate. If the scores are normalized for each of the models would the comparison of scores still make sense to select which product offer to mail. Is there any other method? Pls let me know if it's not clear. Thank you. Renji Abraham |
|
|
You’ll get that from an association model because each product is individually scored. From: [hidden email] [mailto:[hidden email]]
|
|
|
Where can I find the Association Model in SPSS?
You’ll get that from an association model because each product is individually scored. From: [hidden email] [mailto:[hidden email]] Sent: Friday, November 05, 2010 9:12 AM To: ViAnn Beadle Cc: [hidden email] Subject: Re: Comparing Models My understanding is that the market-basket analysis helps to identify what combination of products to offer. But what I am trying to find is what one product to offer among a group of products that the prospect is more likely to purchase.
Why are you approaching the question this way? Typically, predictive marketing models like this are based on market-basket analysis or association models. These models need a lot of data and are usually built from a training set. The actual implementations of models of this type are highly proprietary and valued quite highly. Netflix had a competition offering the best predictor $Millions (?) if they could beat the Netflix internal model. SPSS Inc. has a variety of advanced predictive marketing tools which include association models. From: SPSSX(r) Discussion [hidden email] On Behalf Of <R. Abraham> Sent: Friday, November 05, 2010 7:56 AM To: [hidden email] Subject: Re: Comparing Models Thanks for the reply. I am actually looking to see which product to mail to a prospect. For example, There are three Products A, B & C. All three are totally different products. I build separate acquisition models (A, B, C) for each of the products. Say for Prospect 'X', the predicted probability scores for the 3 products are as follows: Model A --- 0.65426 Model B --- 0.75123 Model C --- 0.55458 If we were to compare the scores above, it would seem that we should mail product B to the prospect. But that wouldn't be accurate 'coz the predicted probability score is relative to the other prospects in the same population for that particular model. So my question is there a method to make the scores across the different models to be in the same scale? So that I can say although the raw predicted probability score is higher in Model B, the prospect 'X' is actually more likely to purchase product A. Again I hope I am being clear. Thank you. Renji Abraham
From: SPSSX(r) Discussion [hidden email] On Behalf Of <R. Abraham> Sent: Thursday, November 04, 2010 10:56 AM To: [hidden email] Subject: Comparing Models Hi List, I was wondering if someone could provide me some suggestions. I want to compare the scores of different logisitic regression (acquisition) models for different products, and based on the scores be able to select which product to mail to a prospect. I know that comparing raw scores would not be accurate. If the scores are normalized for each of the models would the comparison of scores still make sense to select which product offer to mail. Is there any other method? Pls let me know if it's not clear. Thank you. Renji Abraham |
|
|
IBM SPSS Modeler has the most extensive
facilities for this, but there is an extension command for Statistics named
SPSSINC APRIORI that can be downloaded from SPSS Developer Central (www.spss.com/devcentral).
From the help: OVERVIEW: The Apriori command discovers association rules in a dataset, and returns those rules with the highest information content. Association rules associate a particular conclusion (the purchase of a particular product) with a set of conditions (the purchase of several other products). This command requires the Python and R plugins, which are also available from Developer Central. HTH,
Where can I find the Association Model in SPSS?
You’ll get that from an association model because each product is individually scored. From: [hidden email] [mailto:RAbraham@...] Sent: Friday, November 05, 2010 9:12 AM To: ViAnn Beadle Cc: [hidden email] Subject: Re: Comparing Models My understanding is that the market-basket analysis helps to identify what combination of products to offer. But what I am trying to find is what one product to offer among a group of products that the prospect is more likely to purchase.
Why are you approaching the question this way? Typically, predictive marketing models like this are based on market-basket analysis or association models. These models need a lot of data and are usually built from a training set. The actual implementations of models of this type are highly proprietary and valued quite highly. Netflix had a competition offering the best predictor $Millions (?) if they could beat the Netflix internal model. SPSS Inc. has a variety of advanced predictive marketing tools which include association models. From: SPSSX(r) Discussion [hidden email] On Behalf Of <R. Abraham> Sent: Friday, November 05, 2010 7:56 AM To: [hidden email] Subject: Re: Comparing Models Thanks for the reply. I am actually looking to see which product to mail to a prospect. For example, There are three Products A, B & C. All three are totally different products. I build separate acquisition models (A, B, C) for each of the products. Say for Prospect 'X', the predicted probability scores for the 3 products are as follows: Model A --- 0.65426 Model B --- 0.75123 Model C --- 0.55458 If we were to compare the scores above, it would seem that we should mail product B to the prospect. But that wouldn't be accurate 'coz the predicted probability score is relative to the other prospects in the same population for that particular model. So my question is there a method to make the scores across the different models to be in the same scale? So that I can say although the raw predicted probability score is higher in Model B, the prospect 'X' is actually more likely to purchase product A. Again I hope I am being clear. Thank you. Renji Abraham
|
|
|
From the overview, it looks like "the purchase of several other products" is the set of conditions required to predict the purchase of a particular product. And that's what I had thought of the Association Model. But I don't have the set of conditions...I want to know which among a groups of product the prospect is more likely to purchase based on separate probability scores for each product. Is it possible to compare the probability scores of three separate models for the same prospect and determine which model will result in a higher likelihood to purchase? Thanks.
IBM SPSS Modeler has the most extensive facilities for this, but there is an extension command for Statistics named SPSSINC APRIORI that can be downloaded from SPSS Developer Central (www.spss.com/devcentral). From the help: OVERVIEW: The Apriori command discovers association rules in a dataset, and returns those rules with the highest information content. Association rules associate a particular conclusion (the purchase of a particular product) with a set of conditions (the purchase of several other products). This command requires the Python and R plugins, which are also available from Developer Central. HTH, Where can I find the Association Model in SPSS?
You’ll get that from an association model because each product is individually scored. From: [hidden email] [mailto:RAbraham@...] Sent: Friday, November 05, 2010 9:12 AM To: ViAnn Beadle Cc: [hidden email] Subject: Re: Comparing Models My understanding is that the market-basket analysis helps to identify what combination of products to offer. But what I am trying to find is what one product to offer among a group of products that the prospect is more likely to purchase.
|
|
|
Can’t you run your population by each of the models and break the population by deciles ranked by probability of response. If you compare your deciles
scores it could help you decide which models gives a higher likelihood of response for each particular product. You could also build a lift curve for each scenario. Fermin Ornelas, Ph.D. From: SPSSX(r) Discussion [mailto:[hidden email]]
On Behalf Of <R. Abraham>
The Apriori command discovers association rules in a dataset, and returns those rules with the highest information content. Association rules associate a particular conclusion (the purchase of a particular product) with a set of conditions (the purchase
of several other products). This command requires the Python and R plugins, which are also available from Developer Central.
HTH,
NOTICE: This e-mail (and any attachments) may contain PRIVILEGED OR CONFIDENTIAL information and is intended only for the use of the specific individual(s) to whom it is addressed. It may contain information that is privileged and confidential under state and federal law. This information may be used or disclosed only in accordance with law, and you may be subject to penalties under law for improper use or further disclosure of the information in this e-mail and its attachments. If you have received this e-mail in error, please immediately notify the person named above by reply e-mail, and then delete the original e-mail. Thank you. |
| Free forum by Nabble | Edit this page |