Create a graph using Cox model
|
Dear Colleagues, I'd like to create a graph based on a Cox regression model. However, instead of time to event (x-axis) vs. survival probability (y-axis), I'd like to create a graph with predictor (x-axis) vs. survival probability at time= 3 years. The Cox model would have included the predictor. Optimally this graph would include 95%CIs. And I'd like to graph two groups (men & women). Can this be done in SPSSv24? Thanks for your time. Clinton |
|
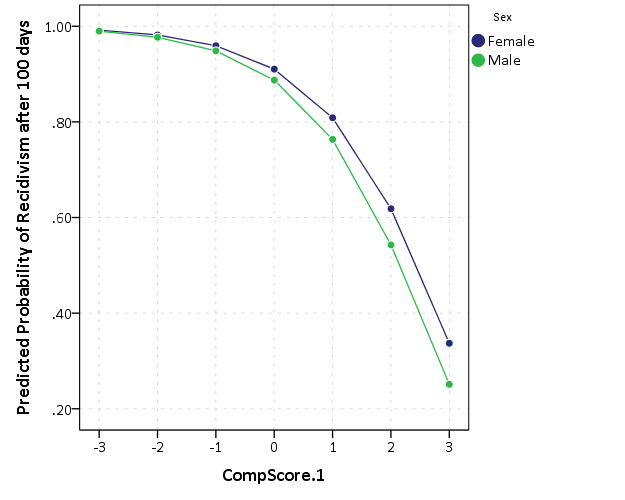
Here is an example. The general idea is this -- generate your regression equation, and save the parameter file. Then create a new set of data with the particular outcomes you want to predict, and then score that file using your prior regression equation. This idea works for the majority of regression procedures in SPSS.
Now here, the scoring only allows you to assign a probability or the cumulative hazard. I am not familiar enough with COX regression models to give any advice about how to generate standard errors around those predictions (or if it is even possible) offhand. ********************************************************************. *Replace with a suitable location on your personal machine. FILE HANDLE save /NAME = "C:\Users\axw161530\Desktop\COXREG_Predict". SPSSINC GETURI DATA URI="https://dl.dropbox.com/s/z62z4fgwc9uyrgm/PreppedCompas.sav?dl=0" FILETYPE=SAV DATASET=CompasRecid. ADD FILES FILE = * /KEEP person_id Recid30 Exposure30 sex marital_status CompScore.1. FREQ sex marital_status CompScore.1. RECODE marital_status ('Married','Significant Other'=1)(ELSE = 0) INTO Married. COMPUTE Male = (Sex = 'Male'). COXREG VARIABLES = Exposure30 WITH Male Married CompScore.1 /STATUS Recid30 (1) /OUTFILE = PARAMETER('save\CoxReg.xml'). *Now create a new dataset with my covariates of interest. *100 days exposed, married, and CompScore ranging from -3 to 3. DATA LIST FREE / Exposure30 Male Married CompScore.1 (4F4.0). BEGIN DATA 100 0 1 -3 100 0 1 -2 100 0 1 -1 100 0 1 0 100 0 1 1 100 0 1 2 100 0 1 3 100 1 1 -3 100 1 1 -2 100 1 1 -1 100 1 1 0 100 1 1 1 100 1 1 2 100 1 1 3 END DATA. DATASET NAME PredictCases. DATASET ACTIVATE PredictCases. MODEL HANDLE NAME=CoxReg FILE='save\CoxReg.xml'. COMPUTE Pred = APPLYMODEL(CoxReg,'Predict'). COMPUTE CumHaz = APPLYMODEL(CoxReg,'CumHazard'). EXECUTE. MODEL CLOSE NAME=CoxReg. *Now making a graph of the two lines. VALUE LABELS Male 0 'Female' 1 'Male'. GGRAPH /GRAPHDATASET NAME="graphdataset" VARIABLES=CompScore.1[name="CompScore_1"] Pred Male MISSING=LISTWISE REPORTMISSING=NO /GRAPHSPEC SOURCE=INLINE. BEGIN GPL SOURCE: s=userSource(id("graphdataset")) DATA: CompScore_1=col(source(s), name("CompScore_1")) DATA: Pred=col(source(s), name("Pred")) DATA: Male=col(source(s), name("Male"), unit.category()) GUIDE: axis(dim(1), label("CompScore.1")) GUIDE: axis(dim(2), label("Predicted Probability of Recidivism after 100 days")) GUIDE: legend(aesthetic(aesthetic.color.interior), label("Sex")) ELEMENT: line(position(CompScore_1*Pred), color.interior(Male)) ELEMENT: point(position(CompScore_1*Pred), color.interior(Male), color.exterior(color.white), size(size."8")) END GPL. ********************************************************************. 
|
«
Return to SPSSX Discussion
|
1 view|%1 views
| Free forum by Nabble | Edit this page |

