Custom survival plot and tables
|
I usually use SPSS for medical stats but I am in opposition with my R or Stata colleagues that assumed to easily obtain table and survival plot for presentation.
With SPSS, I cannot obtain for example: - Survival Plot with subject at risk under the plot corresponding to the time line as in R - Custom Tables with the p values integrate in the last column of the table Is there a way to enter a Syntax code to manage this points? Any help would be much appreciated. Best all, Max |
|
Can you give more specific examples of what you are looking for? Linking to an example survival plot you want made from R or Stata would help with that one. Ditto for the table request.
|
|
HI,
1. I would like to to report the decreasing Ns for survivorship as in Figure 2 in the example... https://academic.oup.com/annonc/article/27/12/2196/2282794/Ramucirumab-combined-with-FOLFOX-as-front-line Actually I produce survival plots for each plot I change manually major increment in "scale" option and after I add a manual table with subjects at risks. Is it possible to create a syntax to obtain directly the final plot as in R or Stata? 2. I would to custom table with a column containing the corresponding p value on the right part of the Table. Like in Table 2 in the same paper...Can I do this with Output Management System? Any help would be much appreciated. Max |
|
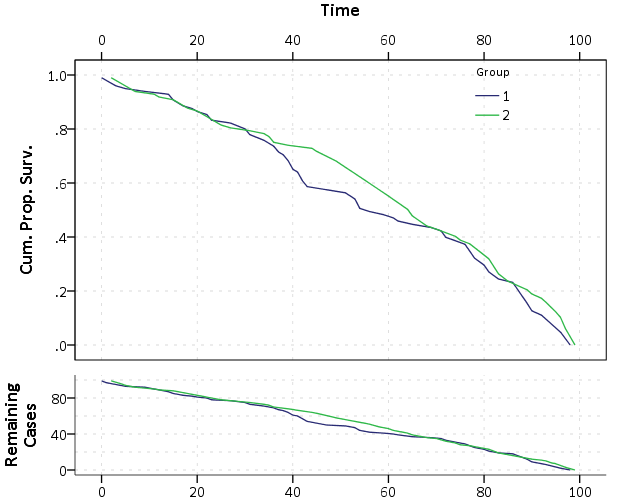
For the plot here is what I would do, instead of making a discrete survival table below the graph, I would just make a second line plot below the KM curve. Here is an example.
***********************************************************************************************. *Simulating example data. INPUT PROGRAM. LOOP #g = 1 TO 2. LOOP #i = 1 TO 100. COMPUTE Id = #i. COMPUTE Group = #g. COMPUTE Time = TRUNC(RV.UNIFORM(0,100)). COMPUTE Censor = RV.BERNOULLI(0.8). END CASE. END LOOP. END LOOP. END FILE. END INPUT PROGRAM. DATASET NAME Sim. FORMATS Group (F1.0). *Making dataset of the survival table. DATASET DECLARE SurvTable. OMS /SELECT TABLES /IF LABELS = 'Survival Table' /DESTINATION FORMAT=SAV OUTFILE='SurvTable'. KM Time /STATUS=Censor(1) /STRATA=Group. OMSEND. DATASET ACTIVATE SurvTable. FORMATS Time (F3.0) Estimate (F2.1). *Usual KM Plot. GGRAPH /GRAPHDATASET NAME="graphdataset" VARIABLES=Time Estimate Var1 /GRAPHSPEC SOURCE=INLINE. BEGIN GPL SOURCE: s=userSource(id("graphdataset")) DATA: Time=col(source(s), name("Time")) DATA: Estimate=col(source(s), name("Estimate")) DATA: Var1=col(source(s), name("Var1"), unit.category()) GUIDE: axis(dim(1), label("Time")) GUIDE: axis(dim(2), label("Cumulative Proportion Surviving at the Time Estimate")) GUIDE: legend(aesthetic(aesthetic.color.interior), label("Group")) ELEMENT: line(position(Time*Estimate), color.interior(Var1)) END GPL. *Cumulative left plot. GGRAPH /GRAPHDATASET NAME="graphdataset" VARIABLES=Time NofRemainingCases Var1 /GRAPHSPEC SOURCE=INLINE. BEGIN GPL SOURCE: s=userSource(id("graphdataset")) DATA: Time=col(source(s), name("Time")) DATA: NofRemainingCases=col(source(s), name("NofRemainingCases")) DATA: Var1=col(source(s), name("Var1"), unit.category()) GUIDE: axis(dim(1), label("Time")) GUIDE: axis(dim(2), label("Number of Remaining Cases")) GUIDE: legend(aesthetic(aesthetic.color.interior), label("Group")) ELEMENT: path(position(Time*NofRemainingCases), color.interior(Var1)) END GPL. *Now putting the two together. GGRAPH /GRAPHDATASET NAME="graphdataset" VARIABLES=Time Estimate Var1 NofRemainingCases /GRAPHSPEC SOURCE=INLINE. BEGIN GPL SOURCE: s=userSource(id("graphdataset")) DATA: Time=col(source(s), name("Time")) DATA: Estimate=col(source(s), name("Estimate")) DATA: NofRemainingCases=col(source(s), name("NofRemainingCases")) DATA: Var1=col(source(s), name("Var1"), unit.category()) GRAPH: begin(origin(12%, 12%), scale(85%, 60%)) GUIDE: axis(dim(1), label("Time"), opposite()) GUIDE: axis(dim(2), label("Cum. Prop. Surv.")) GUIDE: legend(aesthetic(aesthetic.color.interior), label("Group")) ELEMENT: line(position(Time*Estimate), color.interior(Var1)) GRAPH: end() GRAPH: begin(origin(12%, 75%), scale(85%, 20%)) GUIDE: axis(dim(1), label("Time")) GUIDE: axis(dim(2), label("Remaining Cases")) GUIDE: legend(aesthetic(aesthetic.color.interior), null()) ELEMENT: line(position(Time*NofRemainingCases), color.interior(Var1)) GRAPH: end() END GPL. ***********************************************************************************************. 
|
|
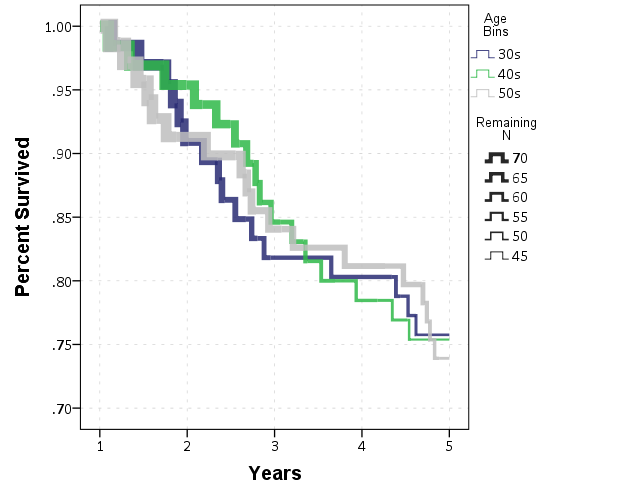
You may also be interested in this prior example KM graph I posted, http://spssx-discussion.1045642.n5.nabble.com/add-number-at-risk-to-the-Kaplan-Meier-plot-in-survival-analysis-td5731847.html#a5731860

|
«
Return to SPSSX Discussion
|
1 view|%1 views
| Free forum by Nabble | Edit this page |

