Thank you very much.
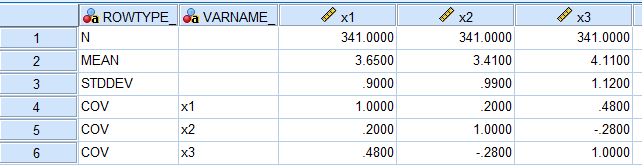
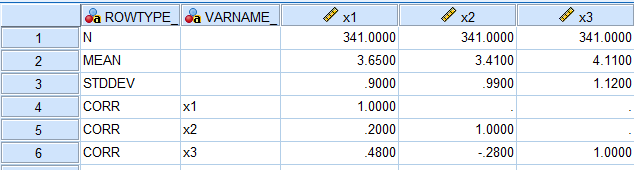
The correlation matrix is done, if I want to try to use covariance matrix, what do I put in?
Any help would be appreciated!!!
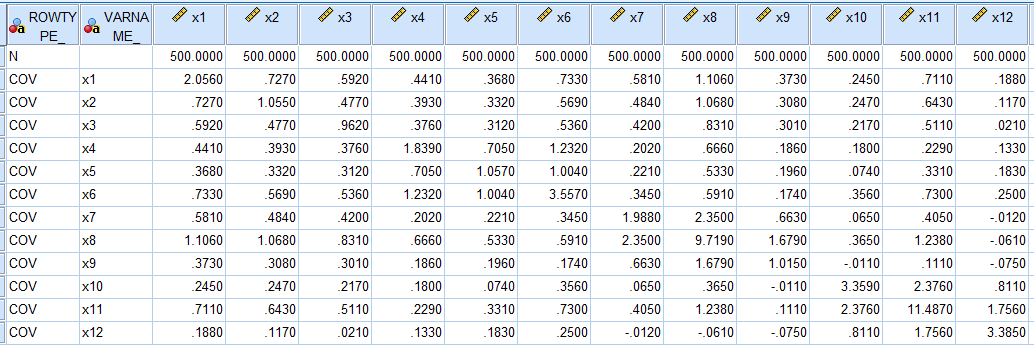
syntax like this:
matrix data variables=rowtype_ x1 x2 x3 x4 x5 x6 x7 x8 x9 x10 x11 x12.
begin data
cov 2.056
cov 0.727 1.055
cov 0.592 0.477 0.962
cov 0.441 0.393 0.376 1.839
cov 0.368 0.332 0.312 0.705 1.057
cov 0.733 0.569 0.536 1.232 1.004 3.557
cov 0.581 0.484 0.420 0.202 0.221 0.345 1.988
cov 1.106 1.068 0.831 0.666 0.533 0.591 2.350 9.719
cov 0.373 0.308 0.301 0.186 0.196 0.174 0.663 1.679 1.015
cov 0.245 0.247 0.217 0.180 0.074 0.356 0.065 0.365 -0.011 3.359
cov 0.711 0.643 0.511 0.229 0.331 0.730 0.405 1.238 0.111 2.376 11.487
cov 0.188 0.117 0.021 0.133 0.183 0.250 -0.012 -0.061 -0.075 0.811 1.756 3.385
n 500 500 500 500 500 500 500 500 500 500 500 500
end data.