Fluctuation Plot

classic Classic list List threaded Threaded
10 messages Options
Reply | Threaded
Open this post in threaded view
|

Fluctuation Plot

jkpeck
This post was updated on .
For examining the relationship of a pair of categorical variables, a fluctuation plot can be quite useful.  

This is available from the Extension Hub.  You might need to start Statistics in Administrator mode on older versions in order to install it.

Here is an example
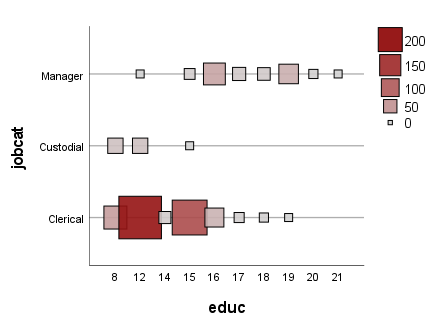


This was developed by Andrew Wheeler and myself a few years ago.  It is actually implemented with GGRAPH/GPL.  You can paste the syntax and tinker with the aesthetics if you like.
Reply | Threaded
Open this post in threaded view
|

Re: Fluctuation Plot

PRogman
I get an Error:
Fluctuation_Chart cannot be installed because it does not have a valid syntax template.

/PR
Reply | Threaded
Open this post in threaded view
|

Re: Fluctuation Plot

Andy W
To much going on for me to dig into this at the moment, but for background

 - https://andrewpwheeler.com/2013/04/25/fluctuation-diagrams-in-spss/
 - https://andrewpwheeler.com/2013/05/10/a-brief-intro-on-building-chart-dialogs-in-spss/

If you just wanted to replicate on your own.
Andy W
apwheele@gmail.com
http://andrewpwheeler.wordpress.com/
Reply | Threaded
Open this post in threaded view
|

Re: Fluctuation Plot

jkpeck
In reply to this post by PRogman
It installed okay for me in V28.  It does not have a template, because it doesn't have syntax.  I have converted it to an extension, so try the spe file from here
https://1drv.ms/u/s!AoWcE61g_FAdisVYHSkMDlQ26ICe9Q?e=ji8ms4

I only tried this install with V28.
Reply | Threaded
Open this post in threaded view
|

Re: Fluctuation Plot

PRogman
Hmm, I get a different error (SPSS v26.0.0.1), even when running SPSS as an administrator, stating:
Cannot install custom dialog to any of the specified locations:
and pointing to the TMP environment variable.

/PR
Reply | Threaded
Open this post in threaded view
|

Re: Fluctuation Plot

jkpeck
Are you able to install other extensions?  If the locations as listed in SHOW EXT are blocked, you might try creating the environment variables that extend the places where the dialogs and code can be written.

Go to the Windows environment dialog (win+i and search for environment).  Then create two new variables pointing to a known, existing writable location.  Mine are set like this.
SPSS_CDIALOGS_PATH=c:\dlgs3
SPSS_EXTENSIONS_PATH=c:\extcommon3

Restart Statistics if it is running, and it should install.

These installation problems have been pretty much eliminated with V28, which uses a virtual environment for Python (and also installs R with Statistics the way it has done for Python for years).
Reply | Threaded
Open this post in threaded view
|

Re: Fluctuation Plot

Kirill Orlov
In reply to this post by jkpeck
Jon, thank you for that!
It may be worth adding a Help file to the dialog.
Reply | Threaded
Open this post in threaded view
|

Re: Fluctuation Plot

jkpeck
This post was updated on .
I usually have help for any custom dialog, but I couldn't think of anything not completely obvious about this dialog.  What would it say?
Reply | Threaded
Open this post in threaded view
|

Re: Fluctuation Plot

PRogman
In reply to this post by jkpeck
Adding the two environment variables did not let me install the extension. When I opened the extension file and closed it - saving it without any changes - installation went smooth as expected :-)
/PR
Reply | Threaded
Open this post in threaded view
|

Re: Fluctuation Plot

jkpeck
Weird.