GPL: Second Y axis with another gauge
GPL: Second Y axis with another gauge
|
Please, help me with GPL syntax to create a graph (such as
scatterplot) with two Y axes but one data points cloud.
The two Y axes are linearly identical, they differ only in in the gauge of labels used. For example, Y is centimeters while Y2 is inches. The data cloud is one, no overlay scatterplot. Imagine the data cases values are in centimeters. So Y naturally displays centimeters. I'd like to add Y2 (parellel to Y) calibrated as "Y*k" or "Y*k+m", that is, a gauge that is some linear modification of Y (k is positive). ===================== To manage your subscription to SPSSX-L, send a message to [hidden email] (not to SPSSX-L), with no body text except the command. To leave the list, send the command SIGNOFF SPSSX-L For a list of commands to manage subscriptions, send the command INFO REFCARD |
|
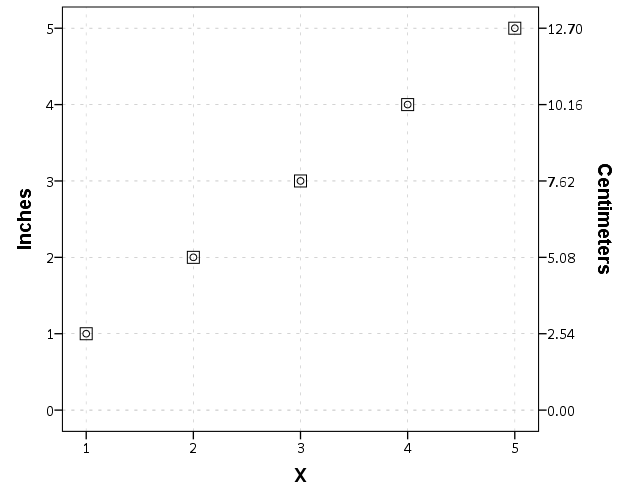
Here is a quick example. To get them exact you need to have a fixed set of end points for both the upper and lower parts of the graph, and you need to have SPSS's chart template have the same default upper/lower margin padding for both axes.
I use my own chart template, which I just updated to make the second axis have the same 5% upper and lower padding for continuous scales (see the dropbox link in the code snippet). I don't know what SPSS's default behavior is. The relevant parts are the: <setAxisMargin categorical="false" role="y2" lowerMargin="5%" upperMargin="5%"/> type settings, where "y" is the default first y axis and "y2" is the second, etc. This is a good example why dual scales are frequently not recommended, or if they are to have a fixed baseline at zero. ****************************************************. *PRESERVE. *See current chart template, https://dl.dropbox.com/s/drnd9nddedd8w6m/chart_style%28AndyW2-presentation%29.sgt?dl=0 . *SET CTEMPLATE='?????MyTemplate?????'. DATA LIST FREE / X Inches (2,F1.0). BEGIN DATA 1 1 2 2 3 3 4 4 5 5 END DATA. GGRAPH /GRAPHDATASET NAME="graphdataset" VARIABLES=X Inches /GRAPHSPEC SOURCE=INLINE. BEGIN GPL SOURCE: s=userSource(id("graphdataset")) DATA: X=col(source(s), name("X")) DATA: Inches=col(source(s), name("Inches")) TRANS: Cent=eval(Inches*2.54) GUIDE: axis(dim(1), label("X")) GUIDE: axis(scale(y1), label("Inches")) GUIDE: axis(scale(y2), label("Centimeters"),opposite()) SCALE: y1 = linear(dim(2), min(0), max(5)) SCALE: y2 = linear(dim(2), min(0), max(12.7)) ELEMENT: point(position(X*Inches), scale(y1), shape(shape.square), size(size."12")) ELEMENT: point(position(X*Cent), scale(y2)) END GPL. *Or with the same markes. GGRAPH /GRAPHDATASET NAME="graphdataset" VARIABLES=X Inches /GRAPHSPEC SOURCE=INLINE. BEGIN GPL SOURCE: s=userSource(id("graphdataset")) DATA: X=col(source(s), name("X")) DATA: Inches=col(source(s), name("Inches")) TRANS: Cent=eval(Inches*2.54) GUIDE: axis(dim(1), label("X")) GUIDE: axis(scale(y1), label("Inches"), start(0), delta(1)) GUIDE: axis(scale(y2), label("Centimeters"),opposite(), start(0), delta(2.54)) SCALE: y1 = linear(dim(2), min(0), max(5)) SCALE: y2 = linear(dim(2), min(0), max(12.7)) ELEMENT: point(position(X*Inches), scale(y1), shape(shape.square), size(size."12")) ELEMENT: point(position(X*Cent), scale(y2)) END GPL. *RESTORE. ****************************************************.  |
Re: GPL: Second Y axis with another gauge
|
Andy,
Thank you very much for your analysis and suggestion. It works, but the solution is not very handy. It actually adds more points (elements) , so it is basically an overlay graph. I was hoping that there can be easier and more straightforward solution just to draw the second axis customarily gauged, without making the axis another scale (scale needs elemens to measure). ===================== To manage your subscription to SPSSX-L, send a message to [hidden email] (not to SPSSX-L), with no body text except the command. To leave the list, send the command SIGNOFF SPSSX-L For a list of commands to manage subscriptions, send the command INFO REFCARD |
|
SPSS's behavior is to not render the axis unless an element statement references it. So even if you have a GUIDE statement it won't draw the guide unless there is an associated chart element referencing that axis.
A simple solution would just be to draw the two elements exactly the same, so they are perfectly superimposed. Another is to draw one of the elements 100% transparent, so they are invisible. Another trick I've used though is to draw an element off of the chart. Below still renders the 2nd Y axis, but the second element statement is off of the chart, so is not drawn. (Also confirmed with V23 and the default template that the margin padding are equal, so no editing needed.) GGRAPH /GRAPHDATASET NAME="graphdataset" VARIABLES=X Inches /GRAPHSPEC SOURCE=INLINE. BEGIN GPL SOURCE: s=userSource(id("graphdataset")) DATA: X=col(source(s), name("X")) DATA: Inches=col(source(s), name("Inches")) TRANS: Yoff = eval(-1) GUIDE: axis(dim(1), label("X")) GUIDE: axis(scale(y1), label("Inches"), start(0), delta(1)) GUIDE: axis(scale(y2), label("Centimeters"),opposite(), start(0), delta(2.54)) SCALE: y1 = linear(dim(2), min(0), max(5)) SCALE: y2 = linear(dim(2), min(0), max(12.7)) ELEMENT: point(position(X*Inches), scale(y1), shape(shape.square), size(size."12")) ELEMENT: point(position(X*Yoff), scale(y2)) END GPL. |
«
Return to SPSSX Discussion
|
1 view|%1 views
| Free forum by Nabble | Edit this page |

