GPL scatterplot - Break long value labels over lines?

GPL scatterplot - Break long value labels over lines?

|
Dear all,
I want to create some scatterplots but the value labels of my identifier variable are rather long (example at end of post). Can I have them break over 2 or 3 lines in any way? My first guess was adding something to the following lines in my chart template: <addDataLabels colorByMarker="false" hidden="false"> <style color="#000000" font-size="8pt" font-style="regular" font-weight="regular" number="0" padding="2px" stroke-width="0.5pt" visible="visible"/> <style color="transparent" color2="transparent" coordinate="1" number="1" visible="true"/> <labeling variable="legend1"/> </addDataLabels> However, I've no clue what I could add here and I believe there's no documentation available on which XML attributes are available for SPSS chart templates in the first place. All suggestions welcome! Ruben The syntax below illustrates the problem I'm having. data list free/Aspect. begin data 1 2 3 4 5 6 7 8 end data. add value labels aspect 1 'Example 1 of a long value label that we sometimes have to find some way to deal with in a reasonable way'. add value labels aspect 2 'Example 2 of a long value label that we sometimes have to find some way to deal with in a reasonable way'. add value labels aspect 3 'Example 3 of a long value label that we sometimes have to find some way to deal with in a reasonable way'. add value labels aspect 4 'Example 4 of a long value label that we sometimes have to find some way to deal with in a reasonable way'. add value labels aspect 5 'Example 5 of a long value label that we sometimes have to find some way to deal with in a reasonable way'. add value labels aspect 6 'Example 6 of a long value label that we sometimes have to find some way to deal with in a reasonable way'. add value labels aspect 7 'Example 7 of a long value label that we sometimes have to find some way to deal with in a reasonable way'. add value labels aspect 8 'Example 8 of a long value label that we sometimes have to find some way to deal with in a reasonable way'. set seed 1. compute v1 = rv.uniform(0,1). compute v2 = rv.uniform(0,1). GGRAPH /GRAPHDATASET NAME="graphdataset" VARIABLES=v1 v2 Aspect MISSING=LISTWISE REPORTMISSING=NO /GRAPHSPEC SOURCE=INLINE. BEGIN GPL SOURCE: s=userSource(id("graphdataset")) DATA: v1=col(source(s), name("v1")) DATA: v2=col(source(s), name("v2")) DATA: Aspect=col(source(s), name("Aspect"), unit.category()) GUIDE: axis(dim(1), label("v1")) GUIDE: axis(dim(2), label("v2")) GUIDE: text.title(label("My Beautiful Scatterplot")) ELEMENT: point(position(v1*v2), label(Aspect)) END GPL. 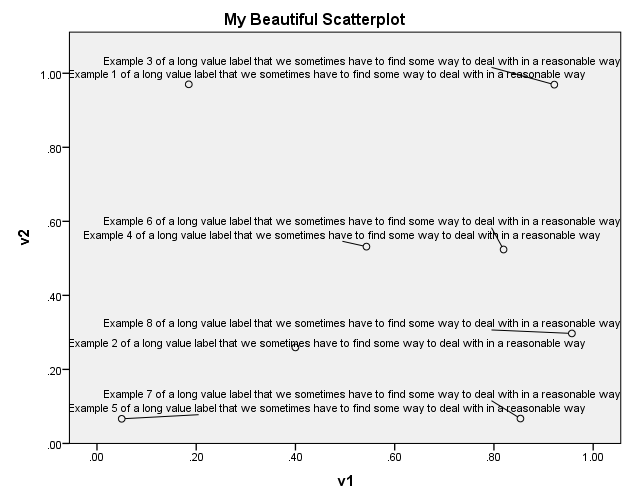
|
|
|
value labels aspect 1 'A label with \n a line break'.
GGRAPH /GRAPHDATASET NAME="graphdataset" VARIABLES=v1 v2 Aspect MISSING=LISTWISE REPORTMISSING=NO /GRAPHSPEC SOURCE=INLINE. BEGIN GPL SOURCE: s=userSource(id("graphdataset")) DATA: v1=col(source(s), name("v1")) DATA: v2=col(source(s), name("v2")) DATA: Aspect=col(source(s), name("Aspect"), unit.category()) GUIDE: axis(dim(1), label("v1")) GUIDE: axis(dim(2), label("v2")) GUIDE: text.title(label("My Beautiful Scatterplot")) ELEMENT: point(position(v1*v2), label(Aspect)) END GPL. 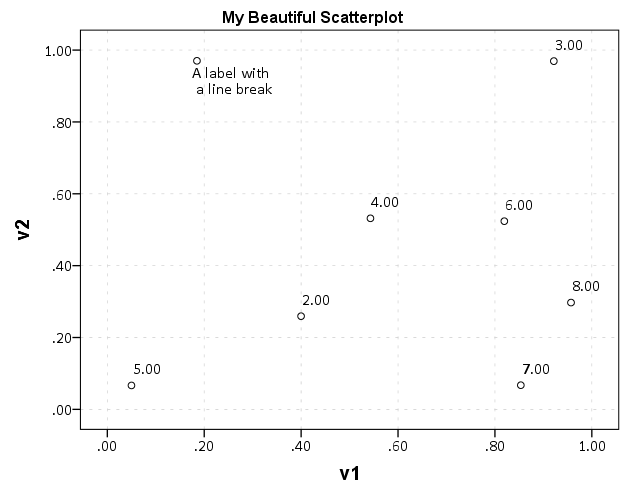
|
|
|
In reply to this post by Ruben Geert van den Berg
You can insert \n in the label to create a break in the label in the chart or in a pivot table. On Mon, Mar 7, 2016 at 11:37 AM, Ruben Geert van den Berg <[hidden email]> wrote: Dear all, |
Re: GPL scatterplot - Break long value labels over lines?
|
|
Thanks for the suggestion!
However, this requires me to insert "\n" into each long value label manually. Can't I have a chart template break them for me? It would save me a lot of work and I wouldn't have to bother my students with such additional steps. Thanks! Ruben |
|
|
I don't think there is a way to put that into a chart template. You could, of course, write a little Python script to edit the labels and run this, perhaps preceded by TEMPORARY. On Mon, Mar 7, 2016 at 12:46 PM, Ruben Geert van den Berg <[hidden email]> wrote: Thanks for the suggestion! |
Re: GPL scatterplot - Break long value labels over lines?
|
|
Thanks Jon!
I'd been thinking about that as well but it kinda feels like "reinventing the wheel". Besides, it'll add complexity to an already complex project. But perhaps I'll do so in the end anyway. I was hoping for an easier solution by using some long forgotten but nicely implemented feature. Best, Ruben |
Re: GPL scatterplot - Break long value labels over lines?
|
Administrator
|
In reply to this post by Jon Peck
I guess I never studied the FM entry for VALUE LABELS closely enough, as I did not know this! Here is the relevant bullet point from the FM:
"To control line wrapping of labels in pivot tables and charts, insert \n as part of the label wherever you want a line break. The \n is not displayed in output; it is interpreted as a line-break character. (Note: Labels will always wrap wherever \n appears in the defined label, even if there is enough space to display the label without wrapping.)"
--
Bruce Weaver bweaver@lakeheadu.ca http://sites.google.com/a/lakeheadu.ca/bweaver/ "When all else fails, RTFM." PLEASE NOTE THE FOLLOWING: 1. My Hotmail account is not monitored regularly. To send me an e-mail, please use the address shown above. 2. The SPSSX Discussion forum on Nabble is no longer linked to the SPSSX-L listserv administered by UGA (https://listserv.uga.edu/). |
«
Return to SPSSX Discussion
|
1 view|%1 views
| Free forum by Nabble | Edit this page |