Graphing multiple data elements with a grouping variable
|
Dear SPSS Syntax Experts, I am trying to graph an independent variable vs. the predictive probability (and 95%CI) from a logistic regression with the lines grouped by gender. I ran the logistic regression via GENLIN because I could save the 95%CI predictive probability data. My plan was to run a scatter plot then fit a quadratic line of best fit to those data and delete the data points. That might not be efficient but it is the method I know. I can do this in Excel/Powerpoint, but was hoping to get 'er done in SPSS. The code shown below does not include a line of best fit. Optimally, I'd like to shade the area between the 95%CIs, but that might be too much to ask. Using chart builder I am able to create a scatter plot of the independent variable vs. predictive probability (without 95%CIs) grouped by gender. Code shown below: **************************************************************************************. * Plot of independent variable vs. predictive probability grouped by gender. GGRAPH /GRAPHDATASET NAME="graphdataset" VARIABLES=pVO2kg MeanPredicted Gender MISSING=LISTWISE REPORTMISSING=NO /GRAPHSPEC SOURCE=INLINE. BEGIN GPL SOURCE: s=userSource(id("graphdataset")) DATA: pVO2kg=col(source(s), name("pVO2kg")) DATA: MeanPredicted=col(source(s), name("MeanPredicted")) DATA: Gender=col(source(s), name("Gender"), unit.category()) GUIDE: axis(dim(1), label("pVO2kg")) GUIDE: axis(dim(2), label("Predicted Value of Mean of Response")) GUIDE: legend(aesthetic(aesthetic.color.exterior), label("Gender")) SCALE: cat(aesthetic(aesthetic.color.exterior), include("0", "1")) ELEMENT: point(position(pVO2kg*MeanPredicted), color.exterior(Gender)) END GPL. **************************************************************************************. I am also able to create this scatter plot with the 95%CI, but WITHOUT grouping by gender. Code shown below: **************************************************************************************. * Plot of independent variable vs. predictive probability (+95%CI); no grouping. GGRAPH /GRAPHDATASET NAME="graphdataset" VARIABLES=pVO2kg MeanPredicted CIMeanPredictedLower CIMeanPredictedUpper MISSING=LISTWISE REPORTMISSING=NO /GRAPHSPEC SOURCE=INLINE. BEGIN GPL SOURCE: s=userSource(id("graphdataset")) DATA: pVO2kg=col(source(s), name("pVO2kg")) DATA: MeanPredicted=col(source(s), name("MeanPredicted")) DATA: CIMeanPredictedLower=col(source(s), name("CIMeanPredictedLower")) DATA: CIMeanPredictedUpper=col(source(s), name("CIMeanPredictedUpper")) DATA: Gender=col(source(s), name("Gender"), unit.category()) GUIDE: axis(dim(1), label("pVO2kg")) GUIDE: axis(dim(2), label("Predicted Value of Mean of Response")) TRANS: pVO2kg_MeanPredicted=eval("pVO2kg - Predicted Value of Mean of Response") TRANS: pVO2kg_CIMeanPredictedL=eval("pVO2kg - Lower Bound of CI for Mean of Response") TRANS: pVO2kg_CIMeanPredictedU=eval("pVO2kg - Upper Bound of CI for Mean of Response") ELEMENT: point(position(pVO2kg*MeanPredicted), color.exterior(pVO2kg_MeanPredicted)) ELEMENT: point(position(pVO2kg*CIMeanPredictedLower), color.exterior(pVO2kg_CIMeanPredictedL)) ELEMENT: point(position(pVO2kg*CIMeanPredictedUpper), color.exterior(pVO2kg_CIMeanPredictedU)) END GPL. **************************************************************************************. Below is my attempt at combining the code shown above. This resulted in a "GPL error: Translation failed." **************************************************************************************. * Plot of independent variable vs. predictive probability (+95%CI) grouped by gender. GGRAPH /GRAPHDATASET NAME="graphdataset" VARIABLES=pVO2kg MeanPredicted CIMeanPredictedLower CIMeanPredictedUpper Gender MISSING=LISTWISE REPORTMISSING=NO /GRAPHSPEC SOURCE=INLINE. BEGIN GPL SOURCE: s=userSource(id("graphdataset")) DATA: pVO2kg=col(source(s), name("pVO2kg")) DATA: MeanPredicted=col(source(s), name("MeanPredicted")) DATA: CIMeanPredictedLower=col(source(s), name("CIMeanPredictedLower")) DATA: CIMeanPredictedUpper=col(source(s), name("CIMeanPredictedUpper")) DATA: Gender=col(source(s), name("Gender"), unit.category()) GUIDE: axis(dim(1), label("pVO2kg")) GUIDE: axis(dim(2), label("Predicted Value of Mean of Response")) GUIDE: legend(aesthetic(aesthetic.color.exterior), label("Gender")) SCALE: cat(aesthetic(aesthetic.color.exterior), include("0", "1")) TRANS: pVO2kg_MeanPredicted=eval("pVO2kg - Predicted Value of Mean of Response") TRANS: pVO2kg_CIMeanPredictedL=eval("pVO2kg - Lower Bound of CI for Mean of Response") TRANS: pVO2kg_CIMeanPredictedU=eval("pVO2kg - Upper Bound of CI for Mean of Response") ELEMENT: point(position(pVO2kg*MeanPredicted), color.exterior(pVO2kg_MeanPredicted)) ELEMENT: point(position(pVO2kg*CIMeanPredictedLower), color.exterior(Gender)) ELEMENT: point(position(pVO2kg*CIMeanPredictedUpper), color.exterior(Gender)) END GPL. **************************************************************************************. Thanks for your time. Best wishes, Clinton A. Brawner |
|
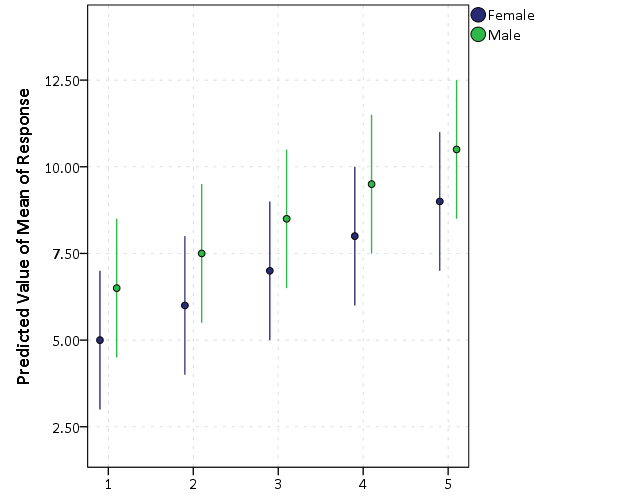
I think this will technically do what you ask for.
********************************************************************. GGRAPH /GRAPHDATASET NAME="graphdataset" VARIABLES=pVO2kg MeanPredicted Gender CIMeanPredictedLower CIMeanPredictedUpper MISSING=LISTWISE REPORTMISSING=NO /GRAPHSPEC SOURCE=INLINE. BEGIN GPL SOURCE: s=userSource(id("graphdataset")) DATA: pVO2kg=col(source(s), name("pVO2kg")) DATA: MeanPredicted=col(source(s), name("MeanPredicted")) DATA: Gender=col(source(s), name("Gender"), unit.category()) DATA: CIMeanPredictedLower=col(source(s), name("CIMeanPredictedLower")) DATA: CIMeanPredictedUpper=col(source(s), name("CIMeanPredictedUpper")) GUIDE: axis(dim(1), label("pVO2kg")) GUIDE: axis(dim(2), label("Predicted Value of Mean of Response")) GUIDE: legend(aesthetic(aesthetic.color.exterior), label("Gender")) SCALE: cat(aesthetic(aesthetic.color.exterior), include("0", "1")) ELEMENT: point(position(pVO2kg*MeanPredicted), color.interior(Gender)) ELEMENT: edge(position(region.spread.range(pVO2kg*(CIMeanPredictedLower + CIMeanPredictedUpper))), color.interior(Gender)) END GPL. ********************************************************************. But I have some different suggestions, especially if the errors overlap, see this blog post, https://andrewpwheeler.wordpress.com/2016/03/08/on-overlapping-error-bars-in-charts/. ************************************************************************************************. DATA LIST FREE / pVO2kg Gender. BEGIN DATA 1 1 1 0 2 1 2 0 3 1 3 0 4 1 4 0 5 1 5 0 END DATA. DATASET NAME Pred. COMPUTE MeanPredicted = 4 + 1.5*(Gender) + pVO2kg. COMPUTE CIMeanPredictedLower = MeanPredicted - 2. COMPUTE CIMeanPredictedUpper = MeanPredicted + 2. FORMATS pVO2kg Gender (F1.0). VALUE LABELS Gender 0 'Female' 1 'Male'. EXECUTE. *Superimposed directly. GGRAPH /GRAPHDATASET NAME="graphdataset" VARIABLES=pVO2kg MeanPredicted Gender CIMeanPredictedLower CIMeanPredictedUpper MISSING=LISTWISE REPORTMISSING=NO /GRAPHSPEC SOURCE=INLINE. BEGIN GPL SOURCE: s=userSource(id("graphdataset")) DATA: pVO2kg=col(source(s), name("pVO2kg")) DATA: MeanPredicted=col(source(s), name("MeanPredicted")) DATA: Gender=col(source(s), name("Gender"), unit.category()) DATA: CIMeanPredictedLower=col(source(s), name("CIMeanPredictedLower")) DATA: CIMeanPredictedUpper=col(source(s), name("CIMeanPredictedUpper")) GUIDE: axis(dim(1), label("pVO2kg")) GUIDE: axis(dim(2), label("Predicted Value of Mean of Response")) GUIDE: legend(aesthetic(aesthetic.color.exterior), label("Gender")) SCALE: cat(aesthetic(aesthetic.color.exterior), include("0", "1")) ELEMENT: edge(position(region.spread.range(pVO2kg*(CIMeanPredictedLower + CIMeanPredictedUpper))), color.interior(Gender)) ELEMENT: point(position(pVO2kg*MeanPredicted), color.interior(Gender)) END GPL. *Can manually displace some. COMPUTE NP = pVO2kg - 0.1 + 0.2*Gender. EXECUTE. GGRAPH /GRAPHDATASET NAME="graphdataset" VARIABLES=NP MeanPredicted Gender CIMeanPredictedLower CIMeanPredictedUpper MISSING=LISTWISE REPORTMISSING=NO /GRAPHSPEC SOURCE=INLINE. BEGIN GPL SOURCE: s=userSource(id("graphdataset")) DATA: pVO2kg=col(source(s), name("NP")) DATA: MeanPredicted=col(source(s), name("MeanPredicted")) DATA: Gender=col(source(s), name("Gender"), unit.category()) DATA: CIMeanPredictedLower=col(source(s), name("CIMeanPredictedLower")) DATA: CIMeanPredictedUpper=col(source(s), name("CIMeanPredictedUpper")) GUIDE: axis(dim(1), label("pVO2kg")) GUIDE: axis(dim(2), label("Predicted Value of Mean of Response")) GUIDE: legend(aesthetic(aesthetic.color.exterior), label("Gender")) SCALE: cat(aesthetic(aesthetic.color.exterior), include("0", "1")) ELEMENT: edge(position(region.spread.range(pVO2kg*(CIMeanPredictedLower + CIMeanPredictedUpper))), color.interior(Gender)) ELEMENT: point(position(pVO2kg*MeanPredicted), color.interior(Gender)) END GPL. *Or treat X as categorical. GGRAPH /GRAPHDATASET NAME="graphdataset" VARIABLES=pVO2kg MeanPredicted Gender CIMeanPredictedLower CIMeanPredictedUpper MISSING=LISTWISE REPORTMISSING=NO /GRAPHSPEC SOURCE=INLINE. BEGIN GPL SOURCE: s=userSource(id("graphdataset")) DATA: pVO2kg=col(source(s), name("pVO2kg"), unit.category()) DATA: MeanPredicted=col(source(s), name("MeanPredicted")) DATA: Gender=col(source(s), name("Gender"), unit.category()) DATA: CIMeanPredictedLower=col(source(s), name("CIMeanPredictedLower")) DATA: CIMeanPredictedUpper=col(source(s), name("CIMeanPredictedUpper")) COORD: rect(dim(1,2), cluster(3,0)) GUIDE: axis(dim(1), label("pVO2kg")) GUIDE: axis(dim(2), label("Predicted Value of Mean of Response")) GUIDE: legend(aesthetic(aesthetic.color.exterior), label("Gender")) SCALE: cat(aesthetic(aesthetic.color.exterior), include("0", "1")) ELEMENT: edge(position(region.spread.range(Gender*(CIMeanPredictedLower + CIMeanPredictedUpper)*pVO2kg)), color.interior(Gender)) ELEMENT: point(position(Gender*MeanPredicted*pVO2kg), color.interior(Gender)) END GPL. ************************************************************************************************. 
|
«
Return to SPSSX Discussion
|
1 view|%1 views
| Free forum by Nabble | Edit this page |

