Interpreting d reference category of logistic regression SPSS & other output results
|
Hi there, could you kindly help me to understand what my reference category and regression equation resulsts are saying.
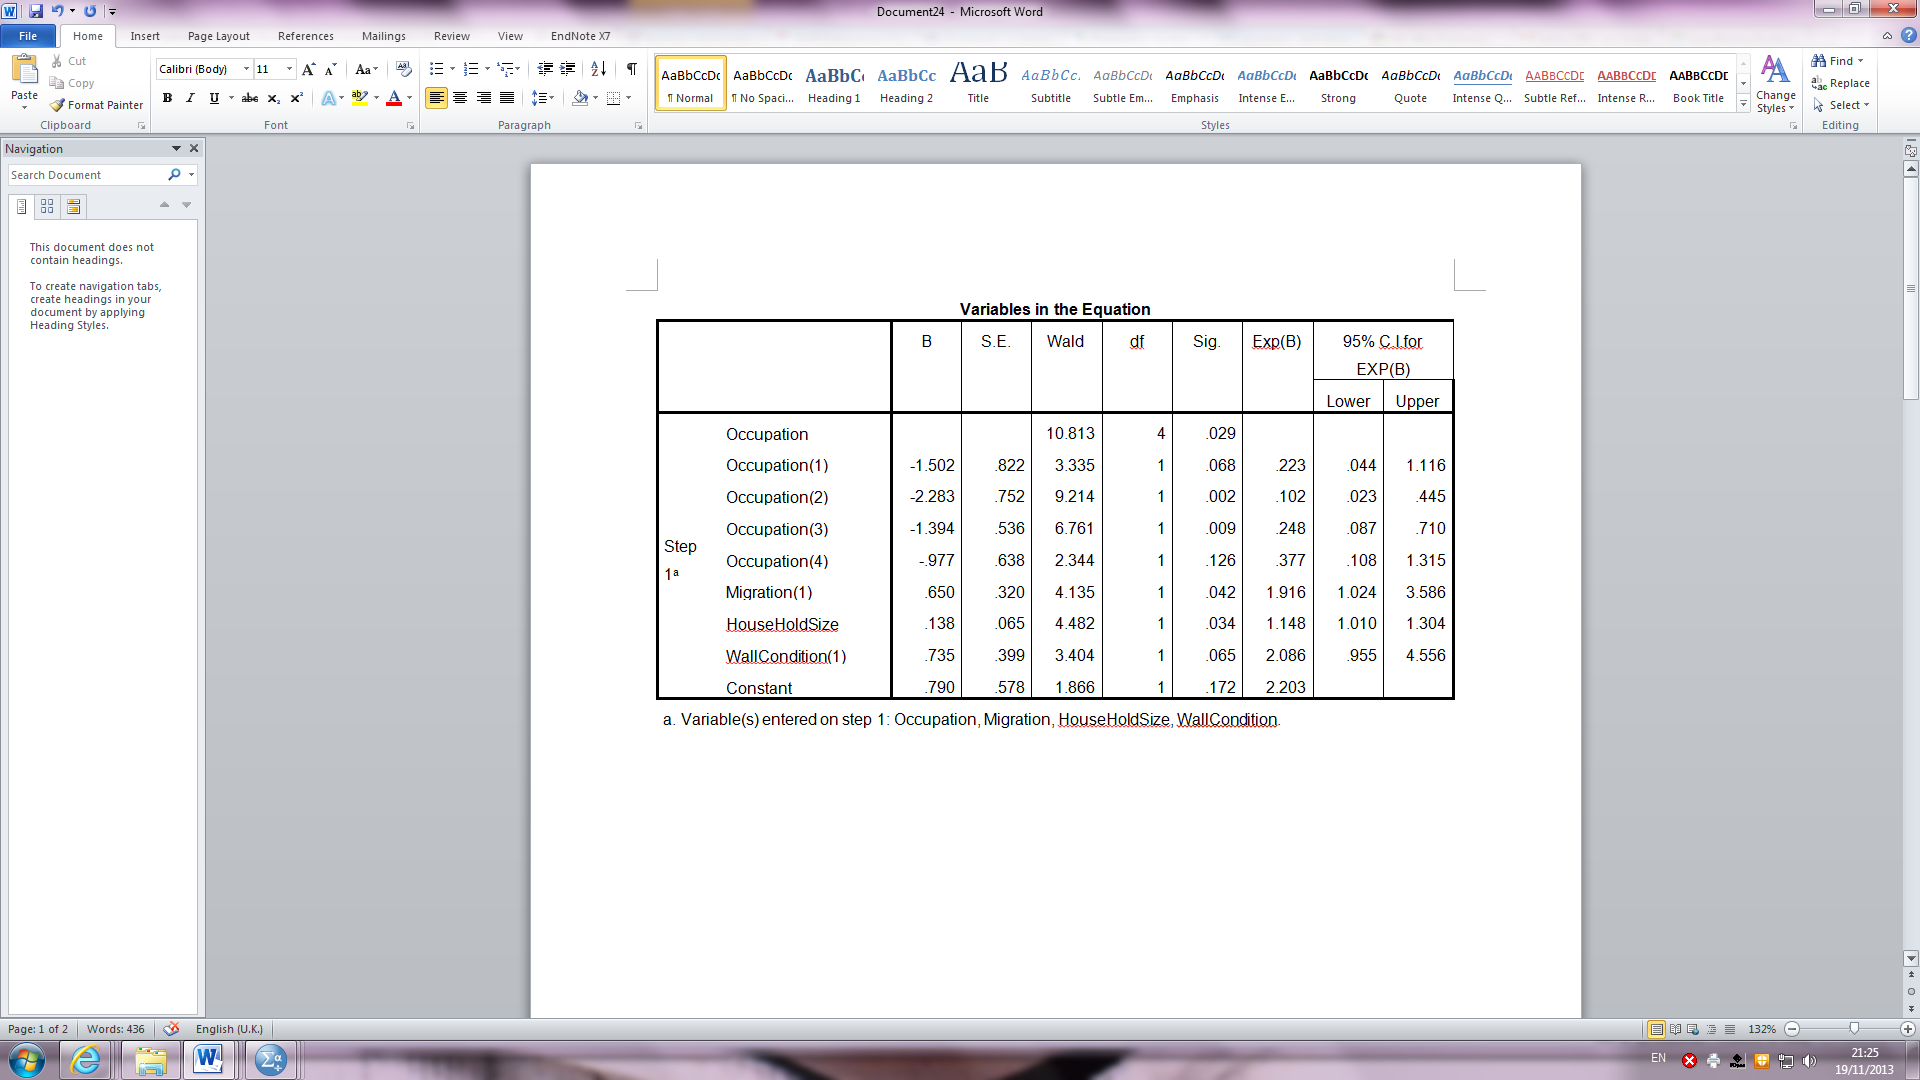
I have run a multivariate logistic regression in SPSS v21 to examine the contributory effects of independent risk variables (IRV) (occupation, migration to rural areas, household size and wall condition) on presence and absence of malaria infection (DV) in households. The results are in the attached file and more detailed explanation of what they represent re described below. Where Occupation categories are: Student: 1 Unemployed: 2 Manual labour/no specialist skills: 3 Semi skilled: 4 Highly skilled: 5 The occupation IRV is categorical and ranked as defined above and I selected “last” as reference category for this IRV and others meaning that for occupation this is the highly skilled class. The p value for this says 0.029. Some of my concerns are as follows. 1. Does it mean that occupation as an IRV is significant? or does it mean only the reference category (high skilled) is significant? I have read somewhere on the internet that the results represents the whole IRV but other references I have read do not expatiate on this so I am quite confused. 2. It is also not giving me any OR or C.I. If this is not the significance value for occupation as an IRV irrespective of category then how can I derive its significance? 3. For the occupation categories what does the result table refer to in terms of occupation? Does it mean as below? Will I be interpreting them individually as separate variables ? occupation (1)= student occupation (2)=unemployed occupation (3)= manual labour/no specialist skills occupation (4)= semi skilled reference (occupation)= highly skilled For the table of results, I understand that if the p value is equal to or less than 0.05 that means its statistically significant and I should reject the null hypothesis. What about other results? 4. In what ways should I be interpreting the B, SE, Wald, df, Constant and the C.I ? 5. Are there other measures that can help me understand the model better? Thank you for your time. :-) 
|
Re: Interpreting d reference category of logistic regression SPSS & other output results
|
Administrator
|
Perhaps this will help?
http://www.ats.ucla.edu/stat/spss/output/logistic.htm
--
Bruce Weaver bweaver@lakeheadu.ca http://sites.google.com/a/lakeheadu.ca/bweaver/ "When all else fails, RTFM." PLEASE NOTE THE FOLLOWING: 1. My Hotmail account is not monitored regularly. To send me an e-mail, please use the address shown above. 2. The SPSSX Discussion forum on Nabble is no longer linked to the SPSSX-L listserv administered by UGA (https://listserv.uga.edu/). |
«
Return to SPSSX Discussion
|
1 view|%1 views
| Free forum by Nabble | Edit this page |


