OT Quantile Regression Why not ranks or percentiles?
OT Quantile Regression Why not ranks or percentiles?
|
Just curious.
As a general rule of thumb one wants a variable to be as fine grained as is practical in the situation. However, the few examples I have seen of quantile regression have coarsened to 5 or so values. Is there a substantive or computational reason for using this few values? -- Art Kendall Social Research Consultants
Art Kendall
Social Research Consultants |
Re: OT Quantile Regression Why not ranks or percentiles?
|
Quantile regression builds models of the
specified quantiles in the same way as ordinary regression builds models
of means, except that they are computationally much more complex. I
doubt that anyone would want to build models of, say, every quantile in
(0,1) by .1. If you are interested in how the coefficients vary by
quantile, a half dozen or so points should give a pretty good picture.
Jon Peck (no "h") aka Kim Senior Software Engineer, IBM [hidden email] phone: 720-342-5621 From: Art Kendall <[hidden email]> To: [hidden email], Date: 10/16/2013 11:48 AM Subject: [SPSSX-L] OT Quantile Regression Why not ranks or percentiles? Sent by: "SPSSX(r) Discussion" <[hidden email]> Just curious. As a general rule of thumb one wants a variable to be as fine grained as is practical in the situation. However, the few examples I have seen of quantile regression have coarsened to 5 or so values. Is there a substantive or computational reason for using this few values? -- Art Kendall Social Research Consultants Art Kendall View this message in context: OT Quantile Regression Why not ranks or percentiles? Sent from the SPSSX Discussion mailing list archive at Nabble.com. |
Re: OT Quantile Regression Why not ranks or percentiles?
|
That makes sense, the
interest would be in n slope coefficients so too many
such slopes would be very difficult to interpret.
Art Kendall
Social Research Consultants
On 10/16/2013 1:59 PM, Jon K Peck wrote: Quantile regression builds models of the specified quantiles in the same way as ordinary regression builds models of means, except that they are computationally much more complex. I doubt that anyone would want to build models of, say, every quantile in (0,1) by .1. If you are interested in how the coefficients vary by quantile, a half dozen or so points should give a pretty good picture. ===================== To manage your subscription to SPSSX-L, send a message to [hidden email] (not to SPSSX-L), with no body text except the command. To leave the list, send the command SIGNOFF SPSSX-L For a list of commands to manage subscriptions, send the command INFO REFCARD
Art Kendall
Social Research Consultants |
|
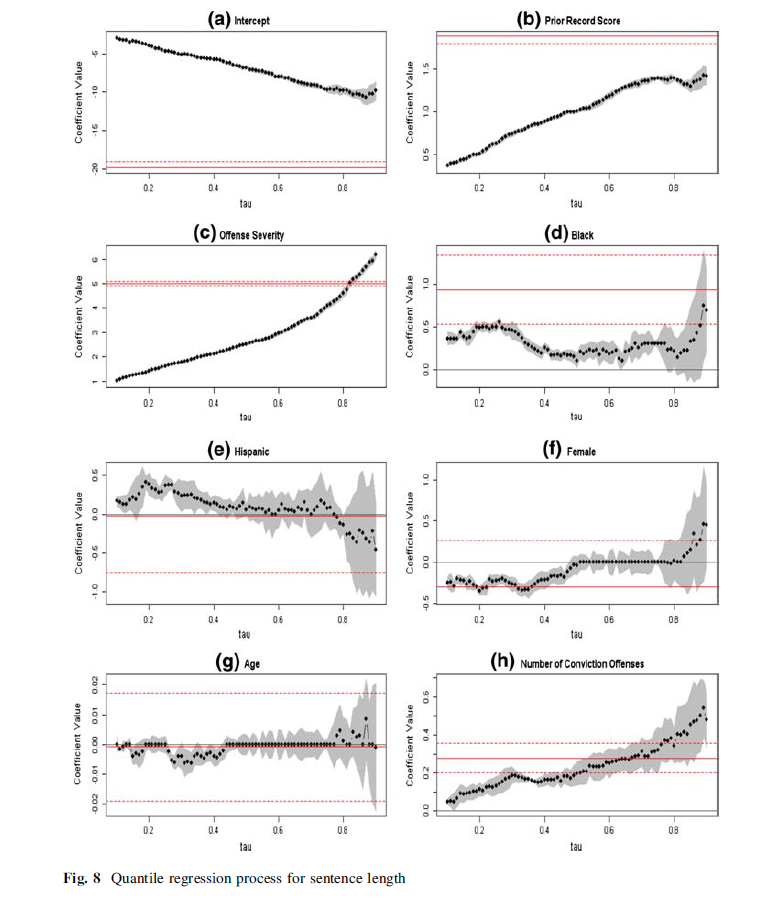
Actually I remember seeing plenty of examples of the opposite, people estimate the coefficients at various quantiles and plot them in a line (plus area for confidence intervals) for the coefficient at various quantiles between .1 and .9.
See Britt, Chester L. "Modeling the distribution of sentence length decisions under a guidelines system: An application of quantile regression models." Journal of Quantitative Criminology 25.4 (2009): 341-370. http://dx.doi.org/10.1007/s10940-009-9066-x Here is a picture taken from Page 360 of the forementioned article  For other online examples see SAS's procedure - http://support.sas.com/documentation/cdl/en/statug/63033/HTML/default/viewer.htm#statug_qreg_sect033.htm And some examples from Stata - http://personal.stthomas.edu/mehartmann/sentencing_disparity_v14.pdf - http://www.decisionsonevidence.com/2011/10/wonkish-statistical-tool-choices-make-a-difference/ A cynic might say most articles only report the coefficients for the "most interesting" quantiles! |
Re: OT Quantile Regression Why not ranks or percentiles?
|
Quantile regression in SPSS using the R module plots the coefficient for each quantile with a confidence interval, including an output table for each coefficient chosen for the model. On Wed, Oct 16, 2013 at 12:43 PM, Andy W <[hidden email]> wrote: Actually I remember seeing plenty of examples of the opposite, people |
Re: OT Quantile Regression Why not ranks or percentiles?
|
In reply to this post by Andy W
The x-axis label on the
picture from page 360 is not very clear on my monitor.
Would you be so kind as to post what it says? Art Kendall Social Research ConsultantsOn 10/16/2013 3:43 PM, Andy W [via SPSSX Discussion] wrote: Actually I remember seeing plenty of examples of the opposite, people estimate the coefficients at various quantiles and plot them in a line (plus area for confidence intervals) for the coefficient at various quantiles between .1 and .9.
Art Kendall
Social Research Consultants |
|
The X axis is labeled as "tau" in text and it represents quantiles. The Tau symbol is often used to represent quantiles, but it seems an oversight to use it as a textual label.
The points in the graph are coefficient estimates of the same model at various different quantiles, from the picture I would guess every at every .02 quantile from between .1 to .9 (the paper doesn't say exactly). The different plots each represent a different coefficient. |
«
Return to SPSSX Discussion
|
1 view|%1 views
| Free forum by Nabble | Edit this page |


