Hi Folks,
I've been using OUTPUT MODIFY to suppress sets of values for which my coefficient of variation is >0.333 (using complex samples). My simple syntax is the following:
OUTPUT MODIFY
/select tables
/tablecells select = ["Coefficient of Variation"]
selectdimension=both selectcondition=["x>0.333"]
applyto= rowdata textcolor=red fontsize=9 replace='F'.
So far my tables have all been oriented the same way, like this:

And my simple syntax does the job by accomplishing the following:

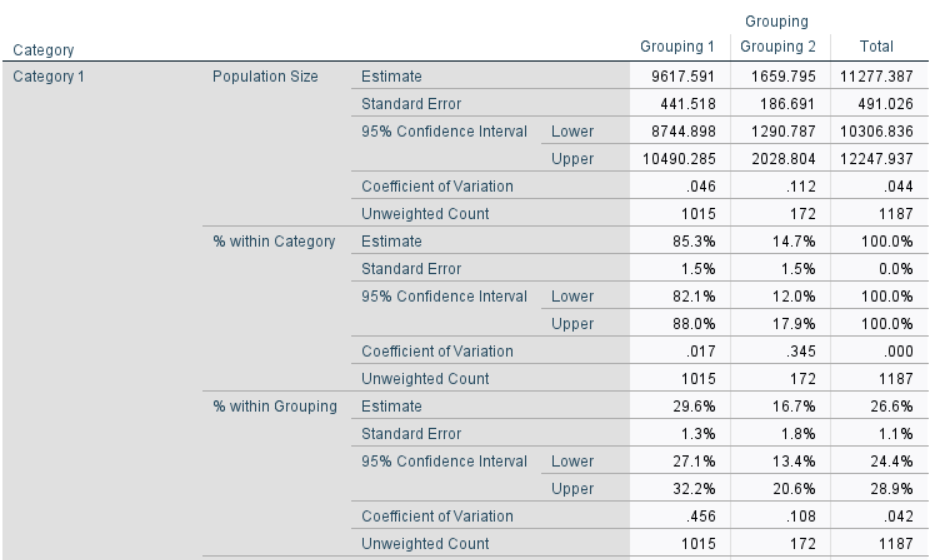
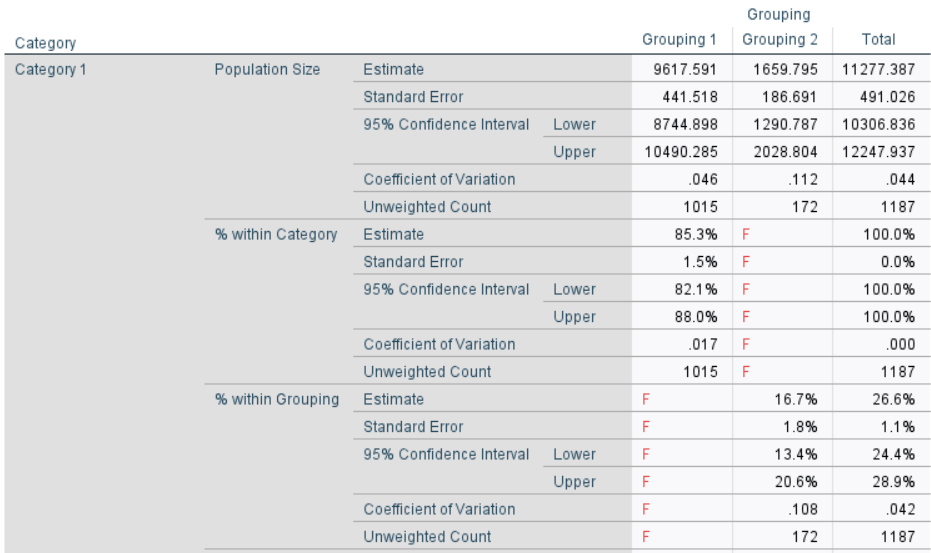
My issue is that now I am doing some more complex crosstabs, like the following:

And I want to accomplish the same thing, as in the following picture:

Is there a way I can do this using OUTPUT MODIFY? I can't seem to figure out how I would select a limited range in this way... I should also say, these different types of tables occur in the same (very long) output files.
Thank you in advance for any help!
Best,
Drew