Output from POWER UNIVARIATE LINEAR

Output from POWER UNIVARIATE LINEAR

Administrator
|
I just noticed that SPSS 27 added some POWER commands. I decided to try out POWER UNIVARIATE LINEAR on the first example shown on this Stata page:
https://www.stata.com/features/overview/power-analysis-for-linear-regression-models/ Scroll down to "Here, we demonstrate PSS for an R2 test of a subset of coefficients in a multiple linear regression" to find the example. The output shows that n = 81 is needed to ensure power of 0.8 to detect a change in R^2 of 0.1 (from 0.1 to 0.2). I used the following SPSS code to carry out the same analysis: POWER UNIVARIATE LINEAR /PARAMETERS MODEL=FIXED SIGNIFICANCE=0.05 POWER=0.8 TOTAL_PREDICTORS=5 TEST_PREDICTORS=2 FULL_MODEL=0.2 NESTED_MODEL=0.1 INTERCEPT =TRUE. The results can be seen in this image: 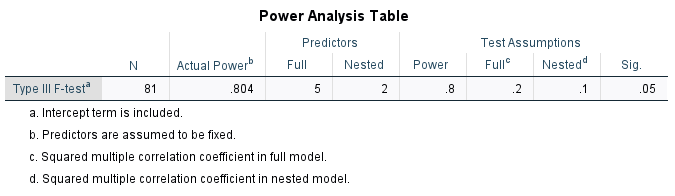 SPSS gives the same estimated sample size as Stata: n = 81. That is not the problem. Here is the problem: The SPSS output shows there are 5 predictors in the full model, and 2 predictors in the "Nested" model. That labeling makes no sense to me given this excerpt from the command syntax: TOTAL_PREDICTORS=5 TEST_PREDICTORS=2 If there are 5 variables in the full model, and 2 predictors that are being tested (for their impact on the change in Rsq), then surely there are 5-2 = 3 variables in the nested, or reduced model. (In the Stata output, this is shown as ncontrol = 3 and ntested = 2.) How are others interpreting the labeling of the Full and Nested columns under Predictors? Is there a mistake in the labeling? Or am I misunderstanding something obvious? Cheers, Bruce
--
Bruce Weaver bweaver@lakeheadu.ca http://sites.google.com/a/lakeheadu.ca/bweaver/ "When all else fails, RTFM." PLEASE NOTE THE FOLLOWING: 1. My Hotmail account is not monitored regularly. To send me an e-mail, please use the address shown above. 2. The SPSSX Discussion forum on Nabble is no longer linked to the SPSSX-L listserv administered by UGA (https://listserv.uga.edu/). |
|
|
A response from one of our statistical team:
Based on my understanding, the customer dislikes the keyword TEST_PREDICTORS in syntax, and considers it confusing. I am aware that NESTED_PREDICTORS could be a better keyword in this case. In our UI, it should be clear. 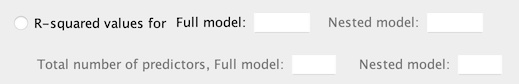 However, the syntax pastes the same keyword for either of the following two cases: 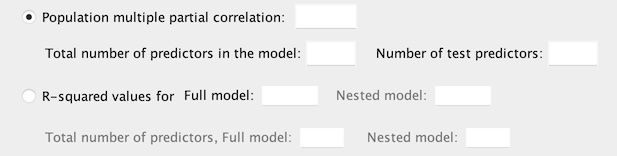 I think this is consistent with the online help which says: TEST_PREDICTORS = integer A required keyword that specifies the number of either the test predictors or the predictors in the nested model (not including the intercept if applicable). When PARTIAL_CORR is specified, the value must be a single integer ∈[1,p], where p is the value specified for TOTAL_PREDICTORS. When FULL_MODEL and NESTED_MODEL are specified, the value must be a single integer ∈[1,p), where p is the value specified for TOTAL_PREDICTORS. |
Re: Output from POWER UNIVARIATE LINEAR
|
Administrator
|
Thanks for jumping in, Richard.
Actually, I like the TEST_PREDICTORS keyword in the syntax just fine. My main complaint is that the OUTPUT should say Full vs Tested under Predictors rather than Full vs Nested. Let's go back to the example I was attempting. Here it is: Consider a test of the significance of two covariates in a multiple linear regression adjusting for three other covariates. We will call the two covariates the tested covariates and the three others control covariates. The reduced model with the control covariates has an R2 of 0.1, and the full model with all five covariates has an R2 of 0.2. We want to compute the required sample size for the two-sided R2 test to achieve 80% power with a 5% significance level—power rsquared defaults. (Source: https://www.stata.com/features/overview/power-analysis-for-linear-regression-models/) The Stata output, which gives the same sample size estimate as SPSS, shows the following: power rsquared 0.1 0.2, ntested(2) ncontrol(3) Estimated sample size for multiple linear regression F test for R2 testing subset of coefficients Ho: R2_F = R2_R versus Ha: R2_F != R2_R Study parameters: alpha = 0.0500 power = 0.8000 delta = 0.1250 R2_R = 0.1000 <<< Rsq for the reduced model with 3 variables R2_F = 0.2000 <<< Rsq for the full model with all 5 variables R2_diff = 0.1000 ncontrol = 3 <<< number of variables in the reduced model ntested = 2 <<< number of variables added in the 2nd block Estimated sample size: N = 81 <<< This matches the result I got using SPSS Here is the SPSS output again (so you don't have to look at another post):  First, notice that in the Test Assumptions columns, Rsq = .2 for the Full model and Rsq = .1 for the "Nested" model. This suggests that SPSS is using "nested" model to mean "reduced" model. Now look at the Predictors columns. The full model is correctly shown to have 5 predictors. But the "nested" (aka., reduced) model is incorrectly shown to have 2 predictors. The reduced model in this example has 3 predictors, not 2. Two predictors are added to the reduced model to reach 5 predictors in the full model. And the test is the F-test on the change in Rsq when adding those 2 variables. So NTESTED = 2, as shown in the command syntax: POWER UNIVARIATE LINEAR /PARAMETERS MODEL=FIXED SIGNIFICANCE=0.05 POWER=0.8 TOTAL_PREDICTORS=5 TEST_PREDICTORS=2 FULL_MODEL=0.2 NESTED_MODEL=0.1 INTERCEPT =TRUE. Finally, if I redo the problem with k=2 variables in block 1 (the reduced model) and k=5 variables in the full model (i.e., with ntested=3), I get n = 92 as the estimated sample size. (Both SPSS and Stata give that same result.) I hope this clarifies the nature of my complaint! ;-) Cheers, Bruce
--
Bruce Weaver bweaver@lakeheadu.ca http://sites.google.com/a/lakeheadu.ca/bweaver/ "When all else fails, RTFM." PLEASE NOTE THE FOLLOWING: 1. My Hotmail account is not monitored regularly. To send me an e-mail, please use the address shown above. 2. The SPSSX Discussion forum on Nabble is no longer linked to the SPSSX-L listserv administered by UGA (https://listserv.uga.edu/). |
|
|
Yes, I understood the complaint, and I don't disagree. Unfortunately, I also don't do the design and implementation. ;)
I will pass along your response. My guess is that there will be a change to the output effective with version 29. Thanks for your interest in our product and your willingness to share your thoughts, complaints, etc. While I can't promise that *every one* will be attended to, I can promise that I will pass them along. Rick M Quality Assurance SPSS BTW: Someone made a request to change the nested effect to .15 and ask if power went up or down. It goes down, precipitously, which I think surprises no one (of course holding N constant at 81 and keeping everything else the same). Here is a chart (from an extension that I am working on - hopefully finished, if I can shake another bug or two out of it): 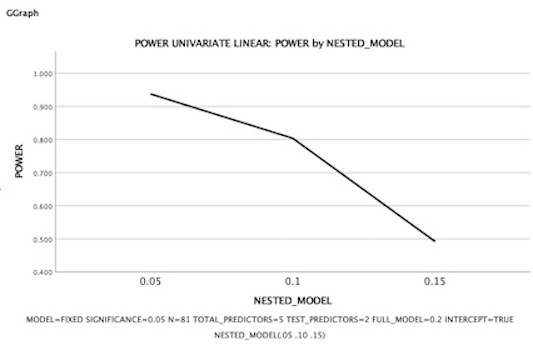
|
Re: Output from POWER UNIVARIATE LINEAR
|
Administrator
|
Thanks very much Richard. Yes, the other Rich who posted that emailed me that same request about changing .1 to .15. The issue was that for the example I chose, Rsq for the reduced model was equal to Rsq-change, which could cause further confusion for someone trying to decipher the output. In light of that, here is another example that avoids the issue.
* Another example. * Block 1: y = b0 +b1*x1 + b2*x2 + b3*x3 + b4*x4 + error * Block 2: y = b0 +b1*x1 + b2*x2 + b3*x3 + b4*x4 + b5*x5 + error * I want power of .8 to detect a change in Rsq from .4 to .45. * The relevant test is a test on the change in Rsq when adding 1 variable, * so NTESTED=1. And there are 4 variables in the block 1 model, * which SPSS calls the nested model. Let's see what the output says! * First, here is the Stata command: * power rsquared 0.4 0.45, ntested(1) ncontrol(4) power(.8) * Stata result: n = 89. POWER UNIVARIATE LINEAR /PARAMETERS MODEL=FIXED SIGNIFICANCE=0.05 POWER=0.8 TOTAL_PREDICTORS=5 TEST_PREDICTORS=1 FULL_MODEL=0.45 NESTED_MODEL=0.4 INTERCEPT =TRUE.  As expected, the output incorrectly shows that there is only 1 variable in the nested (or reduced, or block 1) model. There are 4 variables in block 1 and 1 "tested" variable is added to block 2. I hope this example clarifies things for anyone who was confused by having Rsq for block 1 = Rsq change. Cheers, Bruce
--
Bruce Weaver bweaver@lakeheadu.ca http://sites.google.com/a/lakeheadu.ca/bweaver/ "When all else fails, RTFM." PLEASE NOTE THE FOLLOWING: 1. My Hotmail account is not monitored regularly. To send me an e-mail, please use the address shown above. 2. The SPSSX Discussion forum on Nabble is no longer linked to the SPSSX-L listserv administered by UGA (https://listserv.uga.edu/). |
«
Return to SPSSX Discussion
|
1 view|%1 views
| Free forum by Nabble | Edit this page |