ROC Curve using only frequencies

classic Classic list List threaded Threaded
2 messages Options
Reply | Threaded
Open this post in threaded view
|

ROC Curve using only frequencies

greykittyblues
Hi everyone.
I am just starting to explore spss and data analysis in general.
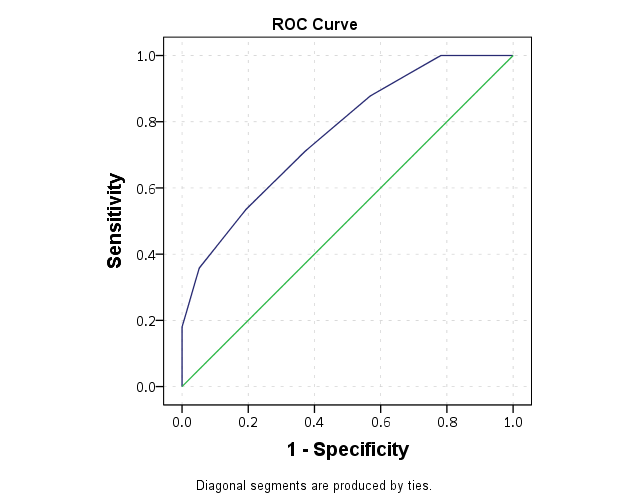
I have data on the diagnostic accuracy of a test method and the results from the standard method for comparison. The data is in the form of frequencies (disease present or absent, for both methods). Will it possible to plot an ROC curve with this kind of data?

Thanks in advance!
Reply | Threaded
Open this post in threaded view
|

Re: ROC Curve using only frequencies

Andy W
I answered a similar question on cross validated recently, http://stats.stackexchange.com/a/181845/1036. You just shape the data correctly and use weights.

**************************************************.
DATA LIST FREE / Absorbance Negative Positive Sp Se.
BEGIN DATA
2           88            0           0.000    1.000
2.5          86            202         0.680    0.977
3.5          79            275         0.926    0.898
4.5          72            290         0.976    0.818
5.5          57            293         0.987    0.648
9            21            295         0.993    0.239
12          0             297         1.000    0.000
END DATA.

VARSTOCASES /MAKE Weight FROM Negative Positive
            /INDEX Outcome.
WEIGHT BY Weight.

ROC Absorbance BY Outcome (2)
  /PLOT CURVE(REFERENCE)
  /PRINT SE COORDINATES.
**************************************************.
Andy W
apwheele@gmail.com
http://andrewpwheeler.wordpress.com/