Reference line from an equation
|
I frequently generate scatterplots using the Chart-builder in the GUI. To
add a *non-linear* fit-line. The GUI for the Chart-builder does not have an option for this, so I use the Chart Editor, and manually "add a reference line from an equation." I'm trying to generate syntax to put in, at the time the graph is generated, a line using the equation I need. The Chart Editor doesn't allow pasting syntax. The Syntax Reference doesn't mention whether this is possible, or how to do it. I've searched the archives, and haven't found any mention of syntax for equation lines. I haven't played around with either GPL or the Data Visualizer, which seems even more opaque. Does anyone know how to do this? Gary ===================== To manage your subscription to SPSSX-L, send a message to [hidden email] (not to SPSSX-L), with no body text except the command. To leave the list, send the command SIGNOFF SPSSX-L For a list of commands to manage subscriptions, send the command INFO REFCARD |
|
Generate a synonymous scatterplot through the chart builder and paste the GPL code, it will look something like below;
GGRAPH /GRAPHDATASET NAME="graphdataset" VARIABLES=VAR00001 VAR00002 MISSING=LISTWISE REPORTMISSING=NO /GRAPHSPEC SOURCE=INLINE. BEGIN GPL SOURCE: s=userSource(id("graphdataset")) DATA: VAR00001=col(source(s), name("VAR00001"), unit.category()) DATA: VAR00002=col(source(s), name("VAR00002")) GUIDE: axis(dim(1), label("VAR00001")) GUIDE: axis(dim(2), label("VAR00002")) SCALE: linear(dim(2), include(0)) ELEMENT: point(position(VAR00001*VAR00002)) END GPL. Then, assuming a linear OLS fit line, add in the line after the point ELEMENT; ELEMENT: line(position(smooth.linear(VAR00001*VAR00002))) See the GPL reference guide for what other types of lines are available (if you had looked they have an example of doing this exact thing). I can understand not reading it front to back - but it is quite painless to look through the examples to at least see what is possible! |
Re: Reference line from an equation
|
Thanks, but I need to insert a non-linear fit line, so I need to specify the
equation. Gary -----Original Message----- From: SPSSX(r) Discussion [mailto:[hidden email]] On Behalf Of Andy W Sent: Friday, April 26, 2013 3:44 PM To: [hidden email] Subject: Re: Reference line from an equation Generate a synonymous scatterplot through the chart builder and paste the GPL code, it will look something like below; GGRAPH /GRAPHDATASET NAME="graphdataset" VARIABLES=VAR00001 VAR00002 MISSING=LISTWISE REPORTMISSING=NO /GRAPHSPEC SOURCE=INLINE. BEGIN GPL SOURCE: s=userSource(id("graphdataset")) DATA: VAR00001=col(source(s), name("VAR00001"), unit.category()) DATA: VAR00002=col(source(s), name("VAR00002")) GUIDE: axis(dim(1), label("VAR00001")) GUIDE: axis(dim(2), label("VAR00002")) SCALE: linear(dim(2), include(0)) ELEMENT: point(position(VAR00001*VAR00002)) END GPL. Then, assuming a linear OLS fit line, add in the line after the point ELEMENT; ELEMENT: line(position(smooth.linear(VAR00001*VAR00002))) See the GPL reference guide for what other types of lines are available (if you had looked they have an example of doing this exact thing). I can understand not reading it front to back - but it is quite painless to look through the examples to at least see what is possible! ----- Andy W [hidden email] http://andrewpwheeler.wordpress.com/ -- View this message in context: http://spssx-discussion.1045642.n5.nabble.com/Reference-line-from-an-equatio n-tp5719770p5719771.html Sent from the SPSSX Discussion mailing list archive at Nabble.com. ===================== To manage your subscription to SPSSX-L, send a message to [hidden email] (not to SPSSX-L), with no body text except the command. To leave the list, send the command SIGNOFF SPSSX-L For a list of commands to manage subscriptions, send the command INFO REFCARD ===================== To manage your subscription to SPSSX-L, send a message to [hidden email] (not to SPSSX-L), with no body text except the command. To leave the list, send the command SIGNOFF SPSSX-L For a list of commands to manage subscriptions, send the command INFO REFCARD |
Re: Reference line from an equation
|
Administrator
|
Understand from the start that I am a COMPLETE NOOB at GGRAPH and there is
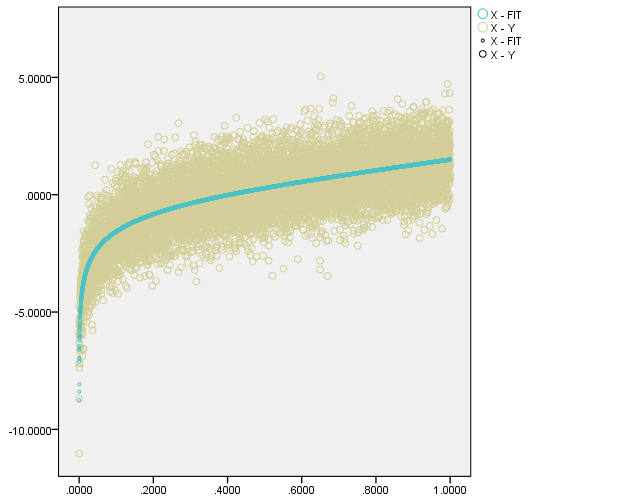
likely a better/easier way . (see Andrew's approach -He is one of the GPL wizards in these parts). RTFM and Apply Andrew's insights and maybe my simulation idea? *<Evil HACK> -. MATRIX. SAVE (UNIFORM(10000,1)) / OUTFILE * / VAR X. END MATRIX. COMPUTE Y=.7 + .3 * X + .5 * X**2 + LN(X) + NORMAL(1). COMPUTE FIT=.7 + .3 * X + .5 * X**2 + LN(X). GGRAPH /GRAPHDATASET NAME="graphdataset" VARIABLES=X Y FIT MISSING=LISTWISE REPORTMISSING=NO /GRAPHSPEC SOURCE=INLINE. BEGIN GPL SOURCE: s=userSource(id("graphdataset")) DATA: X=col(source(s), name("X")) DATA: Y=col(source(s), name("Y")) DATA: FIT=col(source(s), name("FIT")) TRANS: X_Y=eval("X - Y") TRANS: X_FIT=eval("X - FIT") ELEMENT: point(position(X*Y), color.exterior(X_Y)) ELEMENT: point(position(X*FIT), color.exterior(X_FIT)) END GPL. *</EVIL HACK >. 
Please reply to the list and not to my personal email.
Those desiring my consulting or training services please feel free to email me. --- "Nolite dare sanctum canibus neque mittatis margaritas vestras ante porcos ne forte conculcent eas pedibus suis." Cum es damnatorum possederunt porcos iens ut salire off sanguinum cliff in abyssum?" |
|
Yep the logic is basically spelled out by David. The easiest way is to save the predicted values, and put them in a second ELEMENT call (if the data is more sparse you would likely want the fitted values to be a line as opposed to points.) Or you can make the data via TRANS statements in inline GPL. The key is you have to edit in your own second ELEMENT statement.
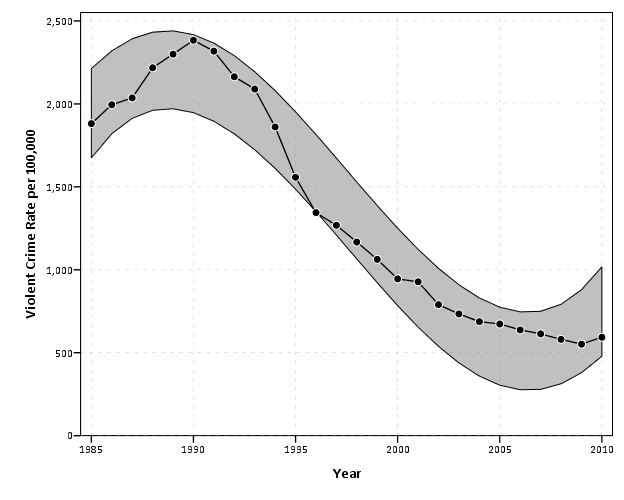
You can see a few more examples here, http://andrewpwheeler.wordpress.com/2013/04/03/some-notes-on-single-line-charts-in-spss/ (error intervals, background guidelines etc.)  |
Re: Reference line from an equation
|
Following Andy W's earlier gentle suggestion to RTM, I finally
found the SPSS GPL Reference Guide. That has an example of the GPL language that you need to add to the GGRAPH command. It's even logical, once you buy a vowel--a graphic vowel. This is my first foray into GPL. First, you define a new variable using a DATA statement and the iter function: DATA: x = iter(<from>, <to>, <step>) Second, you use the TRANS statement and the eval function to generate another variable: TRANS: y = eval(<expression>) Last, you add the new graphic element: ELEMENT: line(position(x*y)) To add an exponential equation for x from 0 to 100, you'd add to your GPL block: DATA: x = iter(0, 100, 0.01) TRANS: y = eval(exp(x)) ELEMENT: line(position(x*y)) The nice thing about this, is that you don't change your working dataset. The x and the y are just working variables. So far as I can tell, there is no generic smooth function that works with any equation. To simulate smoothness, you have to put in smaller steps, which takes up more memory, and slows down execution. One downside is that you can't edit the equation in the Chart Editor. It would be nice to have an extension command that would both drive the GPL addition, and make the line interactive, and editable in the Chart Editor. Gary ----- Original Message ----- From: "Andy W" <[hidden email]> To: [hidden email] Sent: Friday, April 26, 2013 7:27:28 PM Subject: Re: Reference line from an equation Yep the logic is basically spelled out by David. The easiest way is to save the predicted values, and put them in a second ELEMENT call (if the data is more sparse you would likely want the fitted values to be a line as opposed to points.) Or you can make the data via TRANS statements in inline GPL. The key is you have to edit in your own second ELEMENT statement. You can see a few more examples here, http://andrewpwheeler.wordpress.com/2013/04/03/some-notes-on-single-line-charts-in-spss/ (error intervals, background guidelines etc.) <http://spssx-discussion.1045642.n5.nabble.com/file/n5719776/LineCharts1.png> ----- Andy W [hidden email] http://andrewpwheeler.wordpress.com/ -- View this message in context: http://spssx-discussion.1045642.n5.nabble.com/Reference-line-from-an-equation-tp5719770p5719776.html Sent from the SPSSX Discussion mailing list archive at Nabble.com. ===================== To manage your subscription to SPSSX-L, send a message to [hidden email] (not to SPSSX-L), with no body text except the command. To leave the list, send the command SIGNOFF SPSSX-L For a list of commands to manage subscriptions, send the command INFO REFCARD ===================== To manage your subscription to SPSSX-L, send a message to [hidden email] (not to SPSSX-L), with no body text except the command. To leave the list, send the command SIGNOFF SPSSX-L For a list of commands to manage subscriptions, send the command INFO REFCARD |
Re: Reference line from an equation
|
What's wrong with CURVEFIT for this case
if you just want an exponential fit? Or the STATS REGRESS PLOT for
a variety of polynomial or loess filts? Both produce fully editable
charts?
Jon Peck (no "h") aka Kim Senior Software Engineer, IBM [hidden email] phone: 720-342-5621 From: Gary Rosin <[hidden email]> To: [hidden email], Date: 04/26/2013 08:47 PM Subject: Re: [SPSSX-L] Reference line from an equation Sent by: "SPSSX(r) Discussion" <[hidden email]> Following Andy W's earlier gentle suggestion to RTM, I finally found the SPSS GPL Reference Guide. That has an example of the GPL language that you need to add to the GGRAPH command. It's even logical, once you buy a vowel--a graphic vowel. This is my first foray into GPL. First, you define a new variable using a DATA statement and the iter function: DATA: x = iter(<from>, <to>, <step>) Second, you use the TRANS statement and the eval function to generate another variable: TRANS: y = eval(<expression>) Last, you add the new graphic element: ELEMENT: line(position(x*y)) To add an exponential equation for x from 0 to 100, you'd add to your GPL block: DATA: x = iter(0, 100, 0.01) TRANS: y = eval(exp(x)) ELEMENT: line(position(x*y)) The nice thing about this, is that you don't change your working dataset. The x and the y are just working variables. So far as I can tell, there is no generic smooth function that works with any equation. To simulate smoothness, you have to put in smaller steps, which takes up more memory, and slows down execution. One downside is that you can't edit the equation in the Chart Editor. It would be nice to have an extension command that would both drive the GPL addition, and make the line interactive, and editable in the Chart Editor. Gary ----- Original Message ----- From: "Andy W" <[hidden email]> To: [hidden email] Sent: Friday, April 26, 2013 7:27:28 PM Subject: Re: Reference line from an equation Yep the logic is basically spelled out by David. The easiest way is to save the predicted values, and put them in a second ELEMENT call (if the data is more sparse you would likely want the fitted values to be a line as opposed to points.) Or you can make the data via TRANS statements in inline GPL. The key is you have to edit in your own second ELEMENT statement. You can see a few more examples here, http://andrewpwheeler.wordpress.com/2013/04/03/some-notes-on-single-line-charts-in-spss/ (error intervals, background guidelines etc.) <http://spssx-discussion.1045642.n5.nabble.com/file/n5719776/LineCharts1.png> ----- Andy W [hidden email] http://andrewpwheeler.wordpress.com/ -- View this message in context: http://spssx-discussion.1045642.n5.nabble.com/Reference-line-from-an-equation-tp5719770p5719776.html Sent from the SPSSX Discussion mailing list archive at Nabble.com. ===================== To manage your subscription to SPSSX-L, send a message to [hidden email] (not to SPSSX-L), with no body text except the command. To leave the list, send the command SIGNOFF SPSSX-L For a list of commands to manage subscriptions, send the command INFO REFCARD ===================== To manage your subscription to SPSSX-L, send a message to [hidden email] (not to SPSSX-L), with no body text except the command. To leave the list, send the command SIGNOFF SPSSX-L For a list of commands to manage subscriptions, send the command INFO REFCARD |
«
Return to SPSSX Discussion
|
1 view|%1 views
| Free forum by Nabble | Edit this page |

