Hi there,
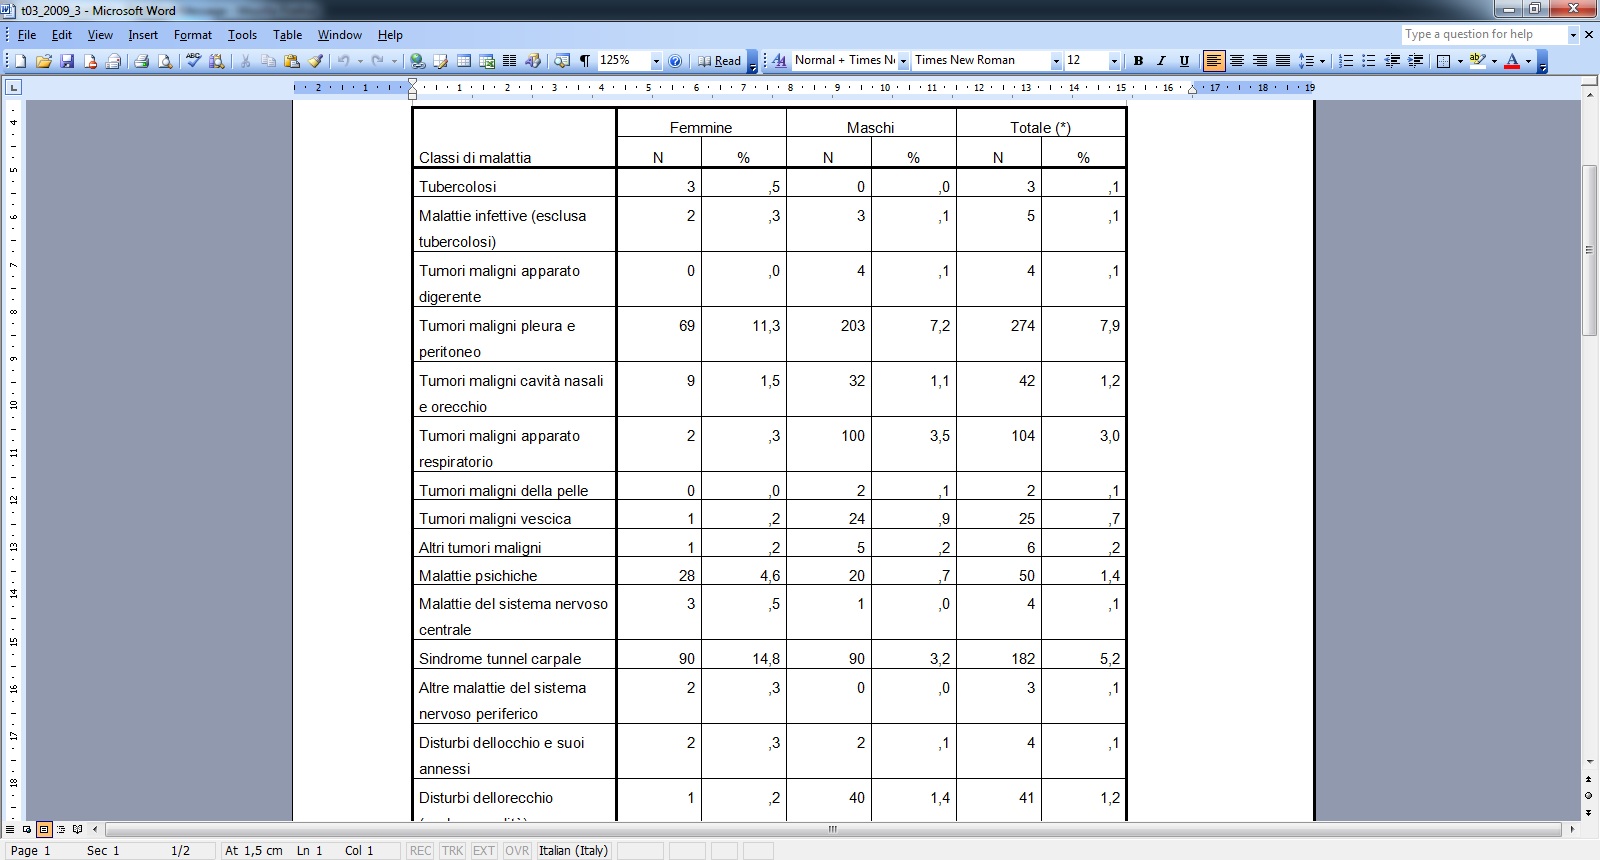
I’ve a problem with the output visualizing. When I run an output in statistics I just can see the number after the comma when the number before the comma is 0. If I select the cell with the slider I can see it, but when I run the output doesn’t show it. How can I get through this? I attach an image of it.
Thx in advance
