Unequal bin size in histograms
|
I have got this material where it would be very convenient to describe the age distribution with varying bin sizes. Thinner intervals for the major part of the material, and broader bins for especially the higher ages. Is there any way to do this in SPSS?
Robert ===================== To manage your subscription to SPSSX-L, send a message to [hidden email] (not to SPSSX-L), with no body text except the command. To leave the list, send the command SIGNOFF SPSSX-L For a list of commands to manage subscriptions, send the command INFO REFCARD
Robert Lundqvist
|
Re: Unequal bin size in histograms
|
<transformation>
<visual binning> .... <paste>
<transformation> <optimal binning> ... <paste> RANK ... /ntiles= ... Art Kendall Social Research ConsultantsOn 10/21/2013 5:33 AM, Robert Lundqvist-3 [via SPSSX Discussion] wrote: I have got this material where it would be very convenient to describe the age distribution with varying bin sizes. Thinner intervals for the major part of the material, and broader bins for especially the higher ages. Is there any way to do this in SPSS?
Art Kendall
Social Research Consultants |
|
In reply to this post by Robert L
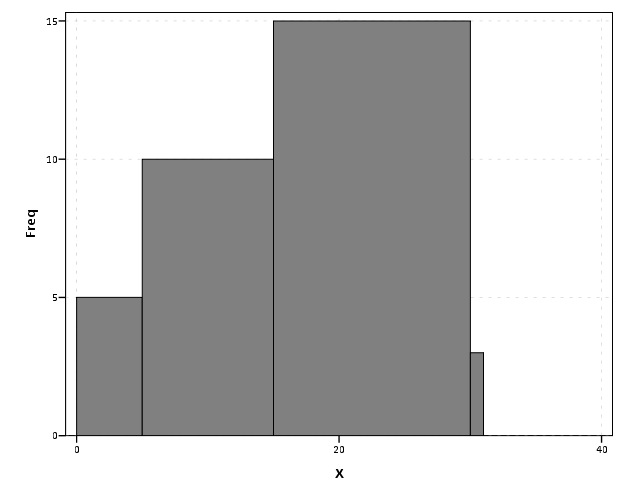
Here is an example in GPL how I would go about doing this in addition to Art's advice. As long as you can make data of the form
begin fence - end fence - height You can use GPL to draw the boxes. I did a similar trick here, http://andrewpwheeler.wordpress.com/2013/04/21/spineplots-in-spss/. It shouldn't be too arduous a programming exercise to whip the data into that shape (but I am unfamiliar with automatic algorithms to produce unequal bin width histograms). ***************************************************************. data list free / beginX endX height. begin data 0 5 5 5 15 10 15 30 15 30 31 3 end data. dataset name unequalHist. formats all (F2.0). *Uneqal Histogram with Polygons. GGRAPH /GRAPHDATASET NAME="graphdataset" VARIABLES=beginX endX height /GRAPHSPEC SOURCE=INLINE. BEGIN GPL SOURCE: s=userSource(id("graphdataset")) DATA: beginX=col(source(s), name("beginX")) DATA: endX=col(source(s), name("endX")) DATA: height=col(source(s), name("height")) TRANS: base=eval(0) TRANS: casenum = index() GUIDE: axis(dim(1), label("X")) GUIDE: axis(dim(2), label("Freq.")) ELEMENT: polygon(position(link.hull((beginX + endX)*(base + height))), color.interior(color.grey), split(casenum)) END GPL. ***************************************************************. 
|
Re: Unequal bin size in histograms
|
In reply to this post by Art Kendall
You can also use RECODE in syntax (substitute your own ranges): This might come in handy first: FREQ oldvar /for not/ per 10 20 30 40 50 60 70 80 90 /his. . . suppresses frequency table, gives deciles (but you can use any quantiles you like and a histogram (if your data are ordinal use /bar instead). RECODE oldvar (value1 thru value2 = 1)(value3 thru value4=2 )(value5 thru value6 = 3) ~ ~ ~ etc etc INTO newvar. From: SPSSX(r) Discussion [mailto:[hidden email]] On Behalf Of Art Kendall <transformation> <visual binning> .... <paste> Art KendallSocial Research ConsultantsOn 10/21/2013 5:33 AM, Robert Lundqvist-3 [via SPSSX Discussion] wrote:
Art Kendall View this message in context: Re: Unequal bin size in histograms |
| Free forum by Nabble | Edit this page |

