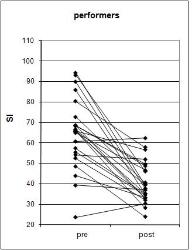
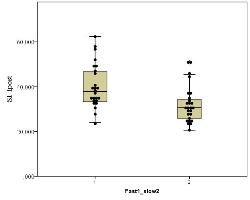
boxplot and line plot in one image together
|
i would like to integrate a line plot into a boxplot. See the two images below. Is itpossible to do this in syntax with the GPL?
  Thanks! |
AW: boxplot and line plot in one image together
|
Hi gpprod
your question is not crystal clear; look if the syntax below would do what you want. So long, Christian DATA LIST LIST/Before After. BEGIN DATA 7.6 14.7 9.9 14.1 8.6 11.8 9.5 16.1 8.4 14.7 9.2 14.1 6.4 13.2 9.9 14.9 8.7 12.2 10.3 13.4 8.3 14.0 END DATA. VARSTOCASES /ID = id /MAKE Time 'Treadmill time (min)' FROM Before After /INDEX = Index(Time). * Chart Builder. GGRAPH /GRAPHDATASET NAME="graphdataset" VARIABLES=Index Time id MISSING=LISTWISE REPORTMISSING=NO /GRAPHSPEC SOURCE=INLINE. BEGIN GPL SOURCE: s=userSource(id("graphdataset")) DATA: Index=col(source(s), name("Index"), unit.category()) DATA: Time=col(source(s), name("Time"), unit.category()) DATA: id=col(source(s), name("id"), unit.category()) GUIDE: axis(dim(1), label("Index")) GUIDE: axis(dim(2), label("Treadmill time (min)")) GUIDE: legend(aesthetic(aesthetic.color.interior), label("id")) SCALE: cat(dim(1), sort.values("Before", "After")) ELEMENT: line(position(Index*Time), color.interior(id), missing.wings()) ELEMENT: schema(position(bin.quantile.letter(Index*Time))) END GPL. ********************************** la volta statistics Christian Schmidhauser, Dr.phil.II Weinbergstrasse 108 CH-8006 Zürich Tel: +41 (043) 233 98 01 Fax: +41 (043) 233 98 02 email: mailto:[hidden email] Web: www.lavolta.ch -----Ursprüngliche Nachricht----- Von: SPSSX(r) Discussion [mailto:[hidden email]] Im Auftrag von gpprod Gesendet: Donnerstag, 11. August 2011 18:58 An: [hidden email] Betreff: boxplot and line plot in one image together i would like to integrate a line plot into a boxplot. See the two images below. Is itpossible to do this in syntax with the GPL? http://spssx-discussion.1045642.n5.nabble.com/file/n4690198/performers.jpg http://spssx-discussion.1045642.n5.nabble.com/file/n4690198/performers21.jpg Thanks! -- View this message in context: http://spssx-discussion.1045642.n5.nabble.com/boxplot-and-line-plot-in-one-i mage-together-tp4690198p4690198.html Sent from the SPSSX Discussion mailing list archive at Nabble.com. ===================== To manage your subscription to SPSSX-L, send a message to [hidden email] (not to SPSSX-L), with no body text except the command. To leave the list, send the command SIGNOFF SPSSX-L For a list of commands to manage subscriptions, send the command INFO REFCARD ===================== To manage your subscription to SPSSX-L, send a message to [hidden email] (not to SPSSX-L), with no body text except the command. To leave the list, send the command SIGNOFF SPSSX-L For a list of commands to manage subscriptions, send the command INFO REFCARD |
|
My intention is to draw such a graph (May this picture is clearer to solve my problem, the lines are photoshopped):
 but i cannot draw the lines. my first try: GGRAPH /GRAPHDATASET NAME="graphdataset" VARIABLES=Fast1_slow2 SI_Ipost MISSING=LISTWISE REPORTMISSING=NO /GRAPHSPEC SOURCE=INLINE. BEGIN GPL SOURCE: s=userSource(id("graphdataset")) DATA: Fast1_slow2=col(source(s), name("Fast1_slow2"), unit.category()) DATA: SI_Ipost=col(source(s), name("SI_Ipost")) DATA: id=col(source(s), name("$CASENUM"), unit.category()) GUIDE: axis(dim(1), label("Fast1_slow2")) GUIDE: axis(dim(2), label("SI_Ipost")) SCALE: linear(dim(2), include(0)) ELEMENT: schema(position(bin.quantile.letter(Fast1_slow2*SI_Ipost)), label(id)) ELEMENT: point.dodge.symmetric(position(bin.dot(Fast1_slow2*SI_Ipost, dim(2))),color(color.black)) END GPL. |
«
Return to SPSSX Discussion
|
1 view|%1 views
| Free forum by Nabble | Edit this page |

