fixed effect with ancova
12
12
|
Administrator
|
IMNSHO, Using Length as a "Covariate" in this case is *WRONG*. It is correlated with the treatments (diet). I should think of this perhaps as a Bivariate response (use both weight and length as dependent variables). OTOH, I don't know WTF I am talking about...Sounds like the OP is fishing!!! HTH, David
Please reply to the list and not to my personal email.
Those desiring my consulting or training services please feel free to email me. --- "Nolite dare sanctum canibus neque mittatis margaritas vestras ante porcos ne forte conculcent eas pedibus suis." Cum es damnatorum possederunt porcos iens ut salire off sanguinum cliff in abyssum?" |
|
IMNSHO=In My Not So Humble Opinion??
Question is when was longcms measured Before the fish started on their diet, as a proxy for intial weight, or after when they were weighed. Gene Maguin -----Original Message----- From: SPSSX(r) Discussion [mailto:[hidden email]] On Behalf Of David Marso Sent: Tuesday, August 23, 2011 10:39 AM To: [hidden email] Subject: Re: fixed effect with ancova IMNSHO, Using Length as a "Covariate" in this case is *WRONG*. It is correlated with the treatments (diet). I should think of this perhaps as a Bivariate response (use both weight and length as dependent variables). OTOH, I don't know WTF I am talking about...Sounds like the OP is fishing!!! HTH, David ===================== To manage your subscription to SPSSX-L, send a message to [hidden email] (not to SPSSX-L), with no body text except the command. To leave the list, send the command SIGNOFF SPSSX-L For a list of commands to manage subscriptions, send the command INFO REFCARD |
|
longcms was measured when i finish my experiment, all data in this analysis was in the same time, when i finish my experiment, others measures (weight and lenght each 3 months) are in other datasheet..
|
|
Ro,
David's right (IMVCO). Longcms has to be highly correlated with weight. You have two DVs. So, two choices: 1) analyze each DV separately as an ANOVA; 2) analyze both DVs together as a multivariate ANOVA, switching over to GLM for this. Gene Maguin -----Original Message----- From: SPSSX(r) Discussion [mailto:[hidden email]] On Behalf Of ro Sent: Tuesday, August 23, 2011 11:14 AM To: [hidden email] Subject: Re: fixed effect with ancova longcms was measured when i finish my experiment, all data in this analysis was in the same time, when i finish my experiment, others measures (weight and lenght each 3 months) are in other datasheet.. -- View this message in context: http://spssx-discussion.1045642.n5.nabble.com/fixed-effect-with-ancova-tp471 3723p4727131.html Sent from the SPSSX Discussion mailing list archive at Nabble.com. ===================== To manage your subscription to SPSSX-L, send a message to [hidden email] (not to SPSSX-L), with no body text except the command. To leave the list, send the command SIGNOFF SPSSX-L For a list of commands to manage subscriptions, send the command INFO REFCARD ===================== To manage your subscription to SPSSX-L, send a message to [hidden email] (not to SPSSX-L), with no body text except the command. To leave the list, send the command SIGNOFF SPSSX-L For a list of commands to manage subscriptions, send the command INFO REFCARD |
|
In reply to this post by Maguin, Eugene
Hi
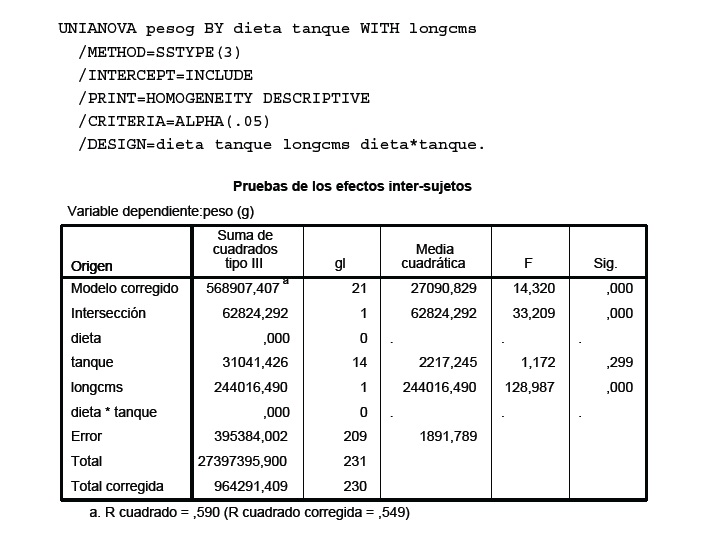
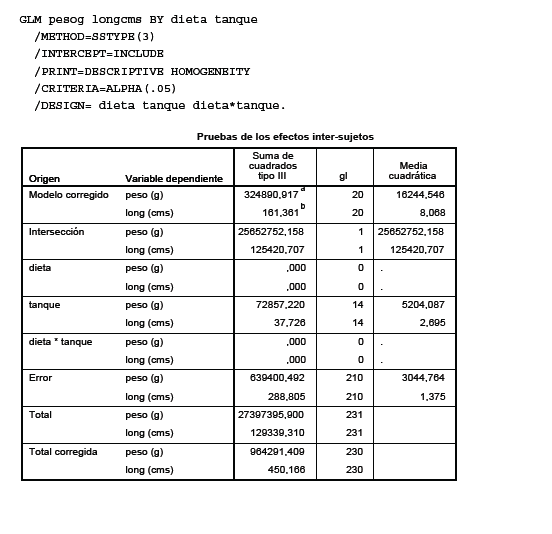
i finish to check all data, then my tank numbers was reduced to 21 and 7 diets (the design was the same that before: 3 tanks by each diet), the number of fishes in each tank is variable, the minimum number of fishes in each tank is 6 but the most of tanks have 12 fishes (unbalanced?)... i am not finish to analysis my data (all data normalized), but it appear have the same problem, i can not find tank effect and interaction and diet effect disappear, other problem is that degree of freedom (ds) in the analysis only compute 14 tanks From 21!! and 0 in diet!!...why? i did the same analysis with genstat software and compute 20 df and 6 diet (exactly the same data) and recognized diet and tank effect but no interaction... when i plot means for tank (x) and diet (y) i see interaction very clear, i thought that the problem is in diet effect, because spss dont compute diet effect... i attach pdf with results 
|
|
Administrator
|
I believe we have clearly established that ANCOVA is *NOT* an appropriate model for this data.
Length and Weight are highly correlated and both are affected by diet and tank. How are your data organized. At one point is seemed as though you had aggregated data by tank, but that does not seem to be the case. IIRC you also have multiple measures over time points (but that might be a different thread). What do you mean by "all data normalized"? Do you mean they have been verified and possibly rectified or have you used some function to "normalize" the data? What happens if you use GLM to jointly model both weight and length as dependent variables with tank and diet as fixed factors. Are you sure you want to treat these as fixed factors?
Please reply to the list and not to my personal email.
Those desiring my consulting or training services please feel free to email me. --- "Nolite dare sanctum canibus neque mittatis margaritas vestras ante porcos ne forte conculcent eas pedibus suis." Cum es damnatorum possederunt porcos iens ut salire off sanguinum cliff in abyssum?" |
|
In reply to this post by E. Bernardo
You can't any anything between the GGRAPH
command and the BEGIN GPL line. Delete the comment and blank lines,
and you should be fine.
Jon Peck (no "h") Senior Software Engineer, IBM [hidden email] new phone: 720-342-5621 From: Eins Bernardo <[hidden email]> To: [hidden email] Date: 08/23/2011 03:54 AM Subject: [SPSSX-L] What is wrong in this syntax? Sent by: "SPSSX(r) Discussion" <[hidden email]> I tried to run the syntax below using version 18 to generate Forest Plot. Unfortunately, it does not work. A warning appeared on the screen as follows:
I appreciate any help. Eins * Sample dataset (processed data )*. DATA LIST LIST/ trial(F4) year(A5) study(A10) measure cilow ciup percwi(4 F8.3). BEGIN DATA 1 "1989" "Hodnett " .502 .262 .962 4.940 2 "1991" "Kennell " .352 .216 .575 8.694 3 "1992" "Bréart-Fr" .785 .483 1.276 8.878 4 "1992" "Bréart-Bg" .811 .653 1.007 44.598 5 "1997" "Gagnon " .867 .573 1.311 12.237 6 "1998" "Langer " .280 .203 .384 20.654 7 " " "Total " .594 .514 .687 100.000 END DATA. */ Assuming you have SPSS 14: SORT CASES BY trial(D). STRING YearAndStudy(A30). COMPUTE YearAndStudy=CONCAT(RTRIM(year)," ",study). COMPUTE RefLine=1. GGRAPH /GRAPHDATASET NAME="graphdataset" VARIABLES=YearAndStudy ciup cilow measure percwi RefLine MISSING=LISTWISE REPORTMISSING=NO /GRAPHSPEC SOURCE=INLINE. * If the effect you are measuring is OR or RR, then this syntax can do the task *. BEGIN GPL SOURCE: s=userSource(id("graphdataset")) DATA: YearAndStudy=col(source(s), name("YearAndStudy"), unit.category()) DATA: ciup=col(source(s), name("ciup")) DATA: cilow=col(source(s), name("cilow")) DATA: measure=col(source(s), name("measure")) DATA: percwi=col(source(s), name("percwi")) DATA: RefLine=col(source(s), name("RefLine")) COORD: transpose(rect(dim(1,2), transpose())) GUIDE: axis(dim(2), label(" Favours treatment Favours Control")) SCALE: cat(dim(1)) SCALE: log(dim(2)) ELEMENT: interval(position(region.spread.range(YearAndStudy*(cilow+ciup))), shape(shape.line), color(color.black)) ELEMENT: point(position(YearAndStudy*measure), shape(shape.square), size(percwi), color.interior(color.black)) ELEMENT: line(position(YearAndStudy*RefLine), shape(shape.line)) END GPL. |
|
In reply to this post by David Marso
Ok David thanks for your comments, yes Length and Weight are highly correlated and both are affected by diet and tank, i supposed that this was one ancova analysis (some papers said the same...), i dont know if a bivariate analysis is anyway one ancova analysis, but anyway i will do one bivariate analysis like you suggest...
all data normalized mean all data have been verified and possibly rectified for THIS analysis...(in other analysis i have used tipical functions: log10, sqrt...) When i run a GLm that you suggest i can not find significatn differences, and have always the same problem that i told you earlier, SPSS can not compute diet effect and df in tank are very low 14 (are 21 tanks...) its normal? my datasheet looks like: fish diet tank weight lenght 1 1 1 # # 2 1 1 # # ...15 1 1 # # 1 1 2 # # 2 1 2 # # ...12 1 2 ... ... 1 1 3 2 1 3 ...9 1 3 1 2 1 2 2 1 ...6 2 1 1 2 2 2 2 2 ...12 2 2 1 2 3 2 2 3 ...1 2 3 ...until diet 7 ... 
|
|
sorry i mistake the results table...here is the correct result...

|
|
Administrator
|
In reply to this post by ro
The way you have your data coded for tank is confusing. You have codes 1,2,3 for each of diets 1,2.
Are these different brands of tank? Same variety of tank? If you indeed have 21 tanks which are *distinct* but homogenous in attributes they should be coded 1,2,...21. Also note that you CANNOT estimate the interaction of diet and tank since they are not CROSSED (if I'm not mistaken diet is nested in tank but so far the description of your experiment is muddled). I suspect the only way you are likely to receive any definitive resolution from posting here is to Attach a copy of your actual data. Something fishy is going on here as if you have 21 tanks you should end up with 21-1=20 df for tank. Take a look at the manual for Nested effects. I suspect rather than /DESIGN diet tank diet*tank you might want /DESIGN diet tank diet(tank) So, something is fishy! Revisit your Linear Statistical Models, Regression, ANOVA and MANOVA texts and please clarify the exact nature of your experimental design. HTH, David --
Please reply to the list and not to my personal email.
Those desiring my consulting or training services please feel free to email me. --- "Nolite dare sanctum canibus neque mittatis margaritas vestras ante porcos ne forte conculcent eas pedibus suis." Cum es damnatorum possederunt porcos iens ut salire off sanguinum cliff in abyssum?" |
|
sorry i mistake, you are right this table was confusing...
yep i agree with you, if you look my first ask in the forum i ask for one nested design i did suspect that maybe this could be a good solution... so i wil do: /DESIGN diet tank diet(tank) all tanks are the same brand and specifications they received the same flux of water and oxigen, only differ from diet treatment... my datasheet REALLY looks like: fish diet tank weight lenght 1 1 1 # # 2 1 1 # # ...15 1 1 # # 1 1 2 # # 2 1 2 # # ...12 1 2 ... ... 1 1 3 2 1 3 ...9 1 3 1 2 4 2 2 4 ...6 2 4 1 2 5 2 2 5 ...12 2 5 1 2 6 2 2 6 ...1 2 6 |
|
In reply to this post by Maguin, Eugene
Hi all,
I just write to give thanks to all who give me comments about my post, now i am more clear about my model and i have good result in my analysis... Regards Rodrigo |
«
Return to SPSSX Discussion
|
1 view|%1 views
| Free forum by Nabble | Edit this page |


