overlay scatterplot syntax
|
Friends,
Can someone fluent in GPL suggest me the code to do 2D (X-Y pairs) and 3D (X-Y-Z triplets) overlay scatterplots with spikes connecting the corresponding points (i.e. the same case in the dataset), and with additional grouping variable denoting marker colour? I'm using SPSS 20. Thank you. |
|
P.S.
Oops, I'm sorry. I meant to
colour differentially the k overlayed clouds, not groups
defined by some additional grouping variable. So, forget about
that grouping variable.
Friends, |
|
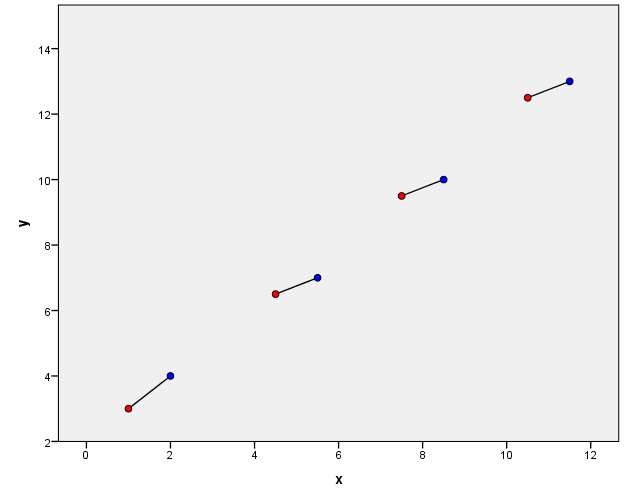
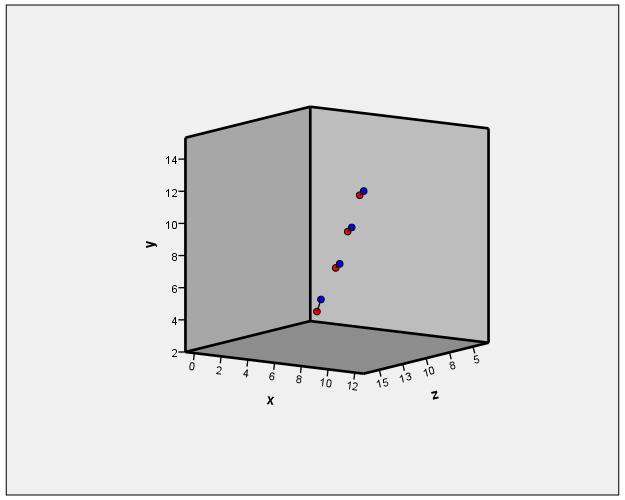
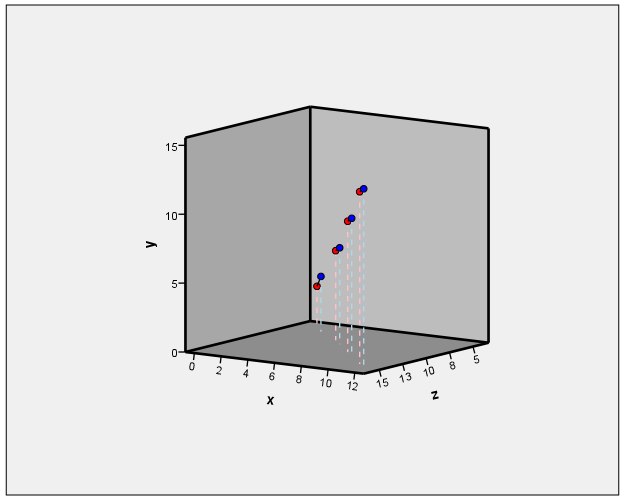
Not quite sure what you mean by color, but here are a few examples with an EDGE connecting the points. At the end of the post are the three images it produces.
*********************************************************************************************. *scatterplots with connected points. data list free / x0 x1 y0 y1 z0 z1. begin data 1 2 3 4 5 6 4.5 5.5 6.5 7 8 9 7.5 8.5 9.5 10 11 12 10.5 11.5 12.5 13 14 15 end data. dataset name test. formats all (F1.0). *In a 2d scatterplot use the edge element - see http://andrewpwheeler.wordpress.com/2012/12/09/using-the-edge-element-in-spss-inline-gpl-with-arbitrary-xy-coordinates/ for an example. GGRAPH /GRAPHDATASET NAME="graphdataset" VARIABLES=x0 y0 x1 y1 /GRAPHSPEC SOURCE=INLINE. BEGIN GPL SOURCE: s=userSource(id("graphdataset")) DATA: x0=col(source(s), name("x0")) DATA: y0=col(source(s), name("y0")) DATA: x1=col(source(s), name("x1")) DATA: y1=col(source(s), name("y1")) GUIDE: axis(dim(1), label("x")) GUIDE: axis(dim(2), label("y")) ELEMENT: edge(position((x0*y0)+(x1*y1))) ELEMENT: point(position(x0*y0), color.interior(color.red)) ELEMENT: point(position(x1*y1), color.interior(color.blue)) END GPL. *3d use an edge as well!. GGRAPH /GRAPHDATASET NAME="graphdataset" VARIABLES=x0 y0 z0 x1 y1 z1 /GRAPHSPEC SOURCE=INLINE. BEGIN GPL SOURCE: s=userSource(id("graphdataset")) DATA: x0=col(source(s), name("x0")) DATA: y0=col(source(s), name("y0")) DATA: z0=col(source(s), name("z0")) DATA: x1=col(source(s), name("x1")) DATA: y1=col(source(s), name("y1")) DATA: z1=col(source(s), name("z1")) COORD: rect(dim(1,2,3)) GUIDE: axis(dim(1), label("z")) GUIDE: axis(dim(2), label("x")) GUIDE: axis(dim(3), label("y")) ELEMENT: edge(position((z0*x0*y0)+(z1*x1*y1)), color.interior(color.black)) ELEMENT: point(position(z0*x0*y0), color.interior(color.red)) ELEMENT: point(position(z1*x1*y1), color.interior(color.blue)) END GPL. *One popular thing to do is to anchor the points to the floor of one of the axes for better guides in the 3d space. *Here I anchor points to x*z floor. GGRAPH /GRAPHDATASET NAME="graphdataset" VARIABLES=x0 y0 z0 x1 y1 z1 /GRAPHSPEC SOURCE=INLINE. BEGIN GPL SOURCE: s=userSource(id("graphdataset")) DATA: x0=col(source(s), name("x0")) DATA: y0=col(source(s), name("y0")) DATA: z0=col(source(s), name("z0")) DATA: x1=col(source(s), name("x1")) DATA: y1=col(source(s), name("y1")) DATA: z1=col(source(s), name("z1")) TRANS: yzero=eval(0) COORD: rect(dim(1,2,3)) GUIDE: axis(dim(1), label("z")) GUIDE: axis(dim(2), label("x")) GUIDE: axis(dim(3), label("y")) ELEMENT: edge(position((z0*x0*y0)+(z1*x1*y1)), color.interior(color.black)) ELEMENT: edge(position((z0*x0*y0)+(z0*x0*yzero)), color.interior(color.pink), shape(shape.dash)) ELEMENT: edge(position((z1*x1*y1)+(z1*x1*yzero)), color.interior(color.lightblue), shape(shape.dash)) ELEMENT: point(position(z0*x0*y0), color.interior(color.red)) ELEMENT: point(position(z1*x1*y1), color.interior(color.blue)) END GPL. *Also see this NABBLE post - .http://spssx-discussion.1045642.n5.nabble.com/3-dim-surface-plots-td5718953.html#a5718954. *********************************************************************************************.   
|
«
Return to SPSSX Discussion
|
1 view|%1 views
| Free forum by Nabble | Edit this page |

