Re: OT Quantile Regression Why not ranks or percentiles?
Posted by Andy W on
URL: http://spssx-discussion.165.s1.nabble.com/OT-Quantile-Regression-Why-not-ranks-or-percentiles-tp5722584p5722587.html
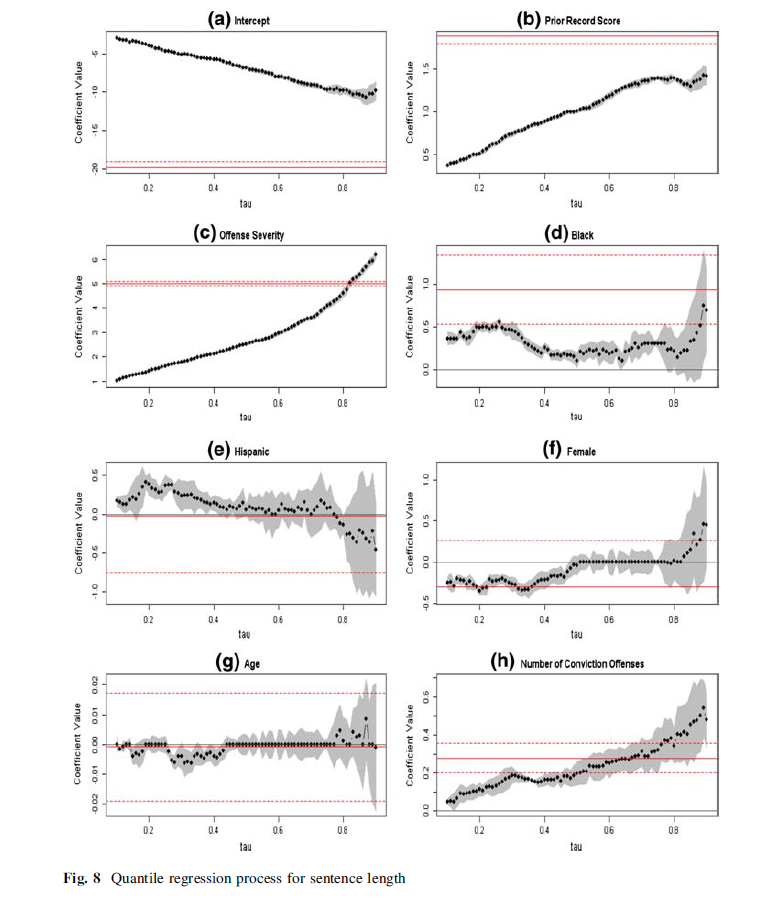
Actually I remember seeing plenty of examples of the opposite, people estimate the coefficients at various quantiles and plot them in a line (plus area for confidence intervals) for the coefficient at various quantiles between .1 and .9.
See
Britt, Chester L. "Modeling the distribution of sentence length decisions under a guidelines system: An application of quantile regression models." Journal of Quantitative Criminology 25.4 (2009): 341-370. http://dx.doi.org/10.1007/s10940-009-9066-x
Here is a picture taken from Page 360 of the forementioned article
For other online examples see
SAS's procedure - http://support.sas.com/documentation/cdl/en/statug/63033/HTML/default/viewer.htm#statug_qreg_sect033.htm
And some examples from Stata
- http://personal.stthomas.edu/mehartmann/sentencing_disparity_v14.pdf
- http://www.decisionsonevidence.com/2011/10/wonkish-statistical-tool-choices-make-a-difference/
A cynic might say most articles only report the coefficients for the "most interesting" quantiles!
URL: http://spssx-discussion.165.s1.nabble.com/OT-Quantile-Regression-Why-not-ranks-or-percentiles-tp5722584p5722587.html
Actually I remember seeing plenty of examples of the opposite, people estimate the coefficients at various quantiles and plot them in a line (plus area for confidence intervals) for the coefficient at various quantiles between .1 and .9.
See
Britt, Chester L. "Modeling the distribution of sentence length decisions under a guidelines system: An application of quantile regression models." Journal of Quantitative Criminology 25.4 (2009): 341-370. http://dx.doi.org/10.1007/s10940-009-9066-x
Here is a picture taken from Page 360 of the forementioned article
For other online examples see
SAS's procedure - http://support.sas.com/documentation/cdl/en/statug/63033/HTML/default/viewer.htm#statug_qreg_sect033.htm
And some examples from Stata
- http://personal.stthomas.edu/mehartmann/sentencing_disparity_v14.pdf
- http://www.decisionsonevidence.com/2011/10/wonkish-statistical-tool-choices-make-a-difference/
A cynic might say most articles only report the coefficients for the "most interesting" quantiles!
| Free forum by Nabble | Edit this page |