Boxplots for pre and post scores with multiple groups
Posted by lost1 on
URL: http://spssx-discussion.165.s1.nabble.com/Boxplots-for-pre-and-post-scores-with-multiple-groups-tp5724951.html
Hello, how can I create graphs to visualize achieved post and pre test scores between different groups. I have following variables. ScoreA_I ScoreA_II ScoreB_I ScoreB_II sex (2 levels) location (2 levels) I imagine something like this: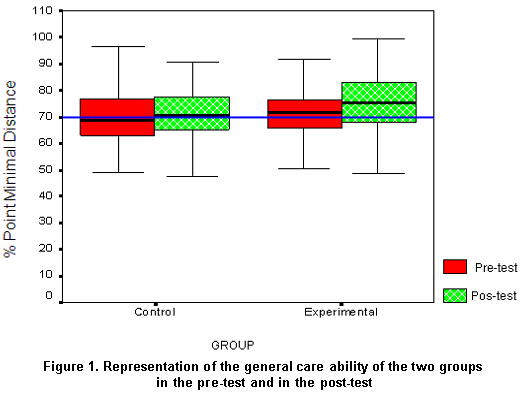 But how do I get pre and post-test scores next to each other?
And is there a way to include the mean?
Thank you!
But how do I get pre and post-test scores next to each other?
And is there a way to include the mean?
Thank you!
URL: http://spssx-discussion.165.s1.nabble.com/Boxplots-for-pre-and-post-scores-with-multiple-groups-tp5724951.html
Hello, how can I create graphs to visualize achieved post and pre test scores between different groups. I have following variables. ScoreA_I ScoreA_II ScoreB_I ScoreB_II sex (2 levels) location (2 levels) I imagine something like this:
But how do I get pre and post-test scores next to each other?
And is there a way to include the mean?
Thank you!
| Free forum by Nabble | Edit this page |