Fluctuation Plot
Posted by jkpeck on
URL: http://spssx-discussion.165.s1.nabble.com/Fluctuation-Plot-tp5740821.html
For examining the relationship of a pair of categorical variables, a fluctuation plot can be quite useful.
This is available from the Extension Hub. You might need to start Statistics in Administrator mode on older versions in order to install it.
Here is an example
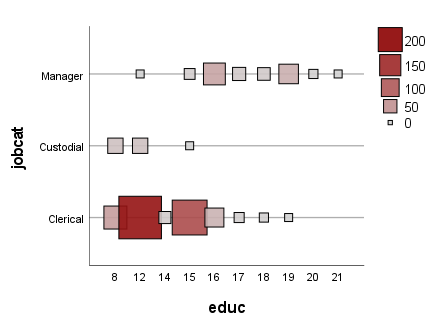
This was developed by Andrew Wheeler and myself a few years ago. It is actually implemented with GGRAPH/GPL. You can paste the syntax and tinker with the aesthetics if you like.
URL: http://spssx-discussion.165.s1.nabble.com/Fluctuation-Plot-tp5740821.html
For examining the relationship of a pair of categorical variables, a fluctuation plot can be quite useful.
This is available from the Extension Hub. You might need to start Statistics in Administrator mode on older versions in order to install it.
Here is an example
This was developed by Andrew Wheeler and myself a few years ago. It is actually implemented with GGRAPH/GPL. You can paste the syntax and tinker with the aesthetics if you like.
| Free forum by Nabble | Edit this page |