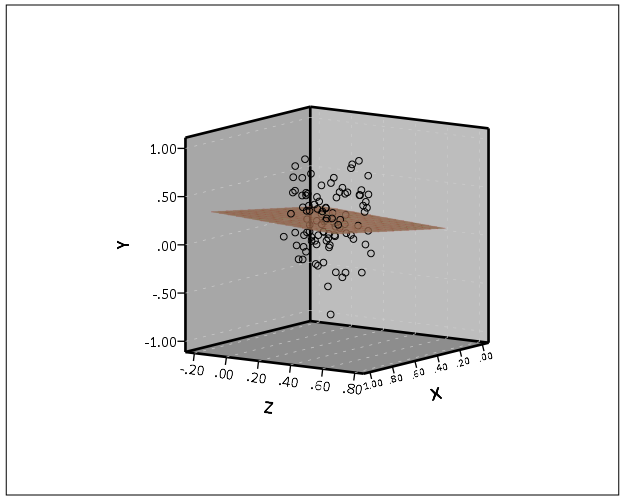
How to create 3d regression plane
|
Hi,
I have already created a 3d scatterplot and have the multiple regression equation. However, I want to be able to create the regression plane. After double clicking and entering into the Chart Editor, the buttons called "Add fit line at total", "Add fit line at subgroups", "Add interpolation line" are all greyed out. I went into "Elements" and everything is greyed out except for "data label mode" and "Show data labels". The variables are all set to Scale. I am using Windows and the SSPSS version is 24. What am I missing? Thanks, |
Re: How to create 3d regression plane
|
Administrator
|
Cross posting? This is obviously the same OP.
Solution for those interested but don't follow the IBM groups. https://developer.ibm.com/answers/questions/335826/how-to-create-regression-plane.html
Please reply to the list and not to my personal email.
Those desiring my consulting or training services please feel free to email me. --- "Nolite dare sanctum canibus neque mittatis margaritas vestras ante porcos ne forte conculcent eas pedibus suis." Cum es damnatorum possederunt porcos iens ut salire off sanguinum cliff in abyssum?" |
|
In reply to this post by bilbo601
I couldn't resist commenting, although I probably should not disseminate this to the internet. Most 3'd graphs are quite poor.
Using the "area" element instead of "line" gives you a bit more aesthetic control in my experiments. (Although just using "point" for the regression plane gets the idea across as well and also can help prevent obstructing other points alittle). ***********************************************. SET SEED 10. INPUT PROGRAM. LOOP Id. = 1 TO 100. END CASE. END LOOP. DATASET NAME Sim. END FILE. END INPUT PROGRAM. COMPUTE X = RV.UNIFORM(0,1). COMPUTE Z = 0.5*X + RV.UNIFORM(-0.2,0.2). COMPUTE Y = 0.1 + 0.2*X - 0.1*Z + RV.NORMAL(0,0.3). EXECUTE. GGRAPH /GRAPHDATASET NAME="graphdataset" VARIABLES=X Y Z /GRAPHSPEC SOURCE=INLINE. BEGIN GPL SOURCE: s=userSource(id("graphdataset")) DATA: X=col(source(s), name("X")) DATA: Y=col(source(s), name("Y")) DATA: Z=col(source(s), name("Z")) GUIDE: axis(dim(1), label("X")) GUIDE: axis(dim(2), label("Z")) GUIDE: axis(dim(3), label("Y")) COORD: rect(dim(1,2,3)) ELEMENT: point(position(X*Z*Y)) ELEMENT: area(position(smooth.linear(X*Z*Y)), color.exterior(color.red), transparency.exterior(transparency."0.9")) END GPL. ***********************************************. 
|
Re: How to create 3d regression plane
|
I concur that 3D graphs can activate perceptual artifacts, especially static 3D ones. However, sometimes it is helpful to edit the output and view the 3D scatterplot from different perspectives.
I tried running the syntax in Version 24. The syntax ran fine. However in the output file, I was not able to rotate the 3D scatterplot to view it from different angles. Is there still a way to rotate 3D scatterplots? Can scatterplots with regression planes be rotated for viewing from different perspectives?
Art Kendall
Social Research Consultants |
|
The viewing angle for 3-d charts can be changed in the Chart Editor, but they can't be dynamically spun. To bring up that dialog, click the toolbar button (next to the lasso). It's pretty hard to identify the button from the image, at least on my screen, but there is a tooltip that will pop up if you hover over it. On Sun, Jan 8, 2017 at 12:27 PM, Art Kendall <[hidden email]> wrote: I concur that 3D graphs can activate perceptual artifacts, especially static |
«
Return to SPSSX Discussion
|
1 view|%1 views
| Free forum by Nabble | Edit this page |

