Inter-item Covariance/Low Reliability
|
This post was updated on .
I'm using the Dutch MMPI-2 Normative Sample (N= 1244) in order to examine a certain scale. Therefore, I selected and recoded the 16 items, which belong to this scale. I'm sure about having selected the right items and the frequency-tables show that my recoding was succesful.
When analyzing the reliability of the items with this command: RELIABILITY /VARIABLES=s002 s011 s018 s036 s097 s142 s182 s204 s229 s252 s258 s282 s294 s298 s307 s404 /SCALE('ALL VARIABLES') ALL/MODEL=ALPHA /STATISTICS=DESCRIPTIVE SCALE CORR COV /SUMMARY=TOTAL. the following warning appears in the output: Reliability The determinant of the covariance matrix is zero or approximately zero. Statistics based on its inverse matrix cannot be computed and they are displayed as system missing values. The inter-item covariance clearly shows that some items have a covariance close to or equal zero. Cronbach's Alpha is equal to .451. I'm surprised to see these results. The items are surely the ones of the scale, so I can't exclude any of them. Why would this scale be introduced if it has only insufficient reliability within a normative sample? When looking for explanations on the net, I read, that covariances close to zero/equal to zero can be the result of missing cases/values. I checked on this, found only 2 cases (N= 1244) with missing values. Excluding theses 2 cases did not change neither the descriptives nor the reliability outcomes. I'm not sure how all this influences my data and how to deal with the warning. Can anyone offer a solution to this problem? Thanks! |
Re: Inter-item Covariance/Low Reliability
|
Administrator
|
The determinate of a matrix being 0 is a result of your one or more of your items being a linear combination of others. You need to look at the possibility of redundancy (have Reliability print the Correlation matrix and look for 1's in the off diagonal). That will locate items with a perfect correlation with others. If there are no such pairs of items then the problem is more complex.
--------------------------------
Please reply to the list and not to my personal email.
Those desiring my consulting or training services please feel free to email me. --- "Nolite dare sanctum canibus neque mittatis margaritas vestras ante porcos ne forte conculcent eas pedibus suis." Cum es damnatorum possederunt porcos iens ut salire off sanguinum cliff in abyssum?" |
Re: Inter-item Covariance/Low Reliability
|
Administrator
|
In reply to this post by SylviP
" inter-item covariance clearly shows that some items have a covariance close to or equal zero. "
That is not what you need to be looking for!!! Items with PERFECT correlation are the culprit. The determinate of a matrix being 0 is a result of your one or more of your items being a linear combination of others. You need to look at the possibility of redundancy (have Reliability print the Correlation matrix and look for 1's in the off diagonal). That will locate items with a perfect correlation with others. If there are no such pairs of items then the problem is more complex. --------------------------------
Please reply to the list and not to my personal email.
Those desiring my consulting or training services please feel free to email me. --- "Nolite dare sanctum canibus neque mittatis margaritas vestras ante porcos ne forte conculcent eas pedibus suis." Cum es damnatorum possederunt porcos iens ut salire off sanguinum cliff in abyssum?" |
|
In reply to this post by SylviP
To repeat what David Marso said but in other words:
Look at the correlation matrix and see if there are any correlations close to 1.00. If so, exclude one or take the average of the two items. If no pairwise correlation is close to 1.00, then one item may be a linear combination of several other variables in which case you will have to try to get the squared multiple correlation of each item with the rest of the items -- which will involve a lot of work. As for why you are getting these results while the original research showed no problem, there are many, many reasons: (1) the original results are a fluke (2) your results are a fluke (3) the scale is sensitive to the population that a sample comes from you're using a different population than the original study (4) the phase of the moon. (5) [insert your favorite joke about the random number gods] (6) etc. A simple solution is find the shortest scale that produces a well-behaved covariance/correlation matrix. If theory can be used to identify a subset of most important items, use that. Otherwise, select 5 items with the highest intercorrelations and run reliability on them. If everything is okay, keep adding items until you start have "degenerate" results like the determinant of the covariance matrix is zero or near zero. Remember using psychological measures like the MMPI is not like using a yardstick to measure length. There are always problems of interpretation, errors in response, etc., that will plague psychological measures. -Mike Palij New York University [hidden email] ----- Original Message ----- From: "SylviP" <[hidden email]> To: <[hidden email]> Sent: Thursday, March 03, 2011 5:28 PM Subject: Inter-item Covariance/Low Reliability > I'm using the Dutch MMPI-2 Normative Sample (N= 1244) in order to examine a > certain scale. Therefore, I selected and recoded the 16 items, which belong > to this scale. I'm sure about having selected the right items and the > frequency-tables show that my recoding was succesful. > > When analyzing the reliability of the items with this command: > > RELIABILITY > /VARIABLES=s002 s011 s018 s036 s097 s142 s182 s204 s229 s252 s258 s282 > s294 s298 s307 s404 > /SCALE('ALL VARIABLES') ALL/MODEL=ALPHA > /STATISTICS=DESCRIPTIVE SCALE CORR COV > /SUMMARY=TOTAL. > > the following warning appears in the output: > > Reliability The determinant of the covariance matrix is zero or > approximately zero. Statistics based on its inverse matrix cannot be > computed and they are displayed as system missing values. > > The inter-item covariance clearly shows that some items have a covariance > close to or equal zero. > > Cronbach's Alpha is equal to .451. > > I'm surprised to see these results. The items are surely the ones of the > scale, so I can't excluded any of them. Why would this scale be introduced > if it has only insufficient reliability within a normative sample? > > When looking for explanations on the net, I read, that covariances close to > zero/equal to zero can be the result of missing cases/values. I checked on > this, found only 2 cases (N= 1244) with missing values. Excluding theses 2 > cases did not change neither the descriptives nor the reliability outcomes. > > I'm not sure how all this influences my data and how to deal with the > warning. Can anyone offer a solution to this problem? > Thanks! > > -- > View this message in context: http://spssx-discussion.1045642.n5.nabble.com/Inter-item-Covariance-Low-Reliability-tp3408731p3408731.html > Sent from the SPSSX Discussion mailing list archive at Nabble.com. > > ===================== > To manage your subscription to SPSSX-L, send a message to > [hidden email] (not to SPSSX-L), with no body text except the > command. To leave the list, send the command > SIGNOFF SPSSX-L > For a list of commands to manage subscriptions, send the command > INFO REFCARD ===================== To manage your subscription to SPSSX-L, send a message to [hidden email] (not to SPSSX-L), with no body text except the command. To leave the list, send the command SIGNOFF SPSSX-L For a list of commands to manage subscriptions, send the command INFO REFCARD |
Re: Inter-item Covariance/Low Reliability
|
In reply to this post by SylviP
Sylvie
Are you sure your recoding is not the source of the problem? I presume you recoded the items to reverse negatively scored items. Check if you have any negative correlations between the items in the original and recoded data. Also worth looking at the item-total correlations. The items with a low item-total correlation are the ones which are reducing your reliability. Garry Gelade. -----Original Message----- From: SPSSX(r) Discussion [mailto:[hidden email]] On Behalf Of SylviP Sent: 03 March 2011 22:28 To: [hidden email] Subject: Inter-item Covariance/Low Reliability I'm using the Dutch MMPI-2 Normative Sample (N= 1244) in order to examine a certain scale. Therefore, I selected and recoded the 16 items, which belong to this scale. I'm sure about having selected the right items and the frequency-tables show that my recoding was succesful. When analyzing the reliability of the items with this command: RELIABILITY /VARIABLES=s002 s011 s018 s036 s097 s142 s182 s204 s229 s252 s258 s282 s294 s298 s307 s404 /SCALE('ALL VARIABLES') ALL/MODEL=ALPHA /STATISTICS=DESCRIPTIVE SCALE CORR COV /SUMMARY=TOTAL. the following warning appears in the output: Reliability The determinant of the covariance matrix is zero or approximately zero. Statistics based on its inverse matrix cannot be computed and they are displayed as system missing values. The inter-item covariance clearly shows that some items have a covariance close to or equal zero. Cronbach's Alpha is equal to .451. I'm surprised to see these results. The items are surely the ones of the scale, so I can't excluded any of them. Why would this scale be introduced if it has only insufficient reliability within a normative sample? When looking for explanations on the net, I read, that covariances close to zero/equal to zero can be the result of missing cases/values. I checked on this, found only 2 cases (N= 1244) with missing values. Excluding theses 2 cases did not change neither the descriptives nor the reliability outcomes. I'm not sure how all this influences my data and how to deal with the warning. Can anyone offer a solution to this problem? Thanks! -- View this message in context: http://spssx-discussion.1045642.n5.nabble.com/Inter-item-Covariance-Low-Reli ability-tp3408731p3408731.html Sent from the SPSSX Discussion mailing list archive at Nabble.com. ===================== To manage your subscription to SPSSX-L, send a message to [hidden email] (not to SPSSX-L), with no body text except the command. To leave the list, send the command SIGNOFF SPSSX-L For a list of commands to manage subscriptions, send the command INFO REFCARD ===================== To manage your subscription to SPSSX-L, send a message to [hidden email] (not to SPSSX-L), with no body text except the command. To leave the list, send the command SIGNOFF SPSSX-L For a list of commands to manage subscriptions, send the command INFO REFCARD |
|
This post was updated on .
In reply to this post by David Marso
Dear Mr. Marso,
thanks a lot for your help! It took me a while to get an overview and to summarize my results. Unfortunately, there is no single perfect correlation between any pair of item. The inter-item correlation matrix for the two scales of interest (with a determinant of covariance close/equal to zero) shows correlations between .001 and .261, resp. between .000 and .597 (positive and negative values). Apparently, the problem seems to be more complex. |
|
In reply to this post by Mike
Dear Mr. Palij,
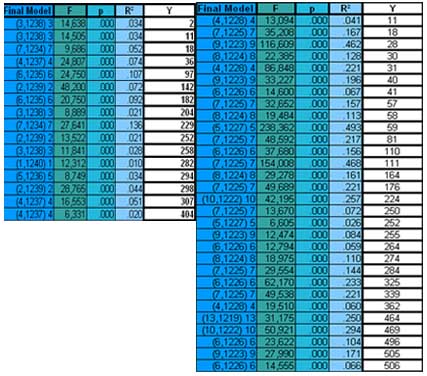
thanks lot for your post as well! As posted before, there is no single perfect correlation between any pair of items. In order to find out, whether one item might be a linear combination of several other items, I examined the squared multiple correlation of each item with the rest of the items with a linear regression analysis (stepwise). These are the results:  I'm not sure about how to deal with the results. Obviously, there is not a single R² close to 1.00 resp. >.80, indicating that an item is the linear combination of several other items. Instead, most R²s are quite small. What are the implications of this? And to what extend, if anyhow, does this effect alpha? But I got what you said: My alpha-results may be influenced by every conceivable factor. Nevertheless, I thought (or hoped) results would be more stable with well validated scales. As a further step, I ran reliability analysis on the 5 items with the highest inter correlation. As an example: results became 'degenerative' when adding item s002. s018, s252, and s258 with respect to scale 1. Well, excluding items on theoretical basis might make sense (is this s.th. I'd mention in my paper resp. in how far do I have to explain that only 12 items of the scale measure the construct in this sample in a reliable manner?), but practically there is no way to exclude them. Beforehand, thanks for your reply! |
Re: Inter-item Covariance/Low Reliability
|
Administrator
|
In reply to this post by SylviP
What are the results of
COMPUTE Scale=SUM(s002, s011, s018, s036, s097, s142, s182, s204, s229, s252, s258, s282,s294, s298, s307, s404). CORR s002 s011 s018 s036 s097 s142 s182 s204 s229 s252 s258 s282 s294 s298 s307 s404 WITH Scale . Untested as I don't have SPSS installed on my currently active OS. Double check the syntax if it doesn't run.
Please reply to the list and not to my personal email.
Those desiring my consulting or training services please feel free to email me. --- "Nolite dare sanctum canibus neque mittatis margaritas vestras ante porcos ne forte conculcent eas pedibus suis." Cum es damnatorum possederunt porcos iens ut salire off sanguinum cliff in abyssum?" |
|
In reply to this post by Garry Gelade
Dear Mr. Gelade,
thanks for replying! I checked on this as well and these are some of the results:  Item s002 is keyed 'false'. I added the keyed direction of the items, their correlation with item s002 'without value labels', 'with value labels' (0=True; 1=False), and after recoding (recode s036...s097: (0=1) (1=0) --> ergo: recode all 'true' keyed items). Recoding the true-keyed items increased alpha from .202 to .451. I'm confused about item s282. I'm absolutely sure, that this item is keyed 'true' and its frequency table shows that recoding makes sense. Why is it performing so differently? Do I need to rely my recoding upon the 'without value labels' correlation? Let's say, if an inter item correlation is positive from the very beginning ('without value labels'), recoding becomes inadequate? The item-total statistics refers to 2 items increasing alpha if deleted: s0204 (alpha=.454) and s282 (alpha= .455). Alpha including all 16 items was equal to .451, so the increase is rather minimal. Honestly, the more I'm trying to find a solution the more I get confused.. Thanks in advance! |
|
In reply to this post by David Marso
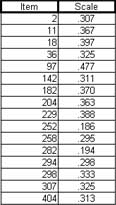
I ran the syntax without any problems and this is the result:
 (Pearson correlation every item with scale) |
Re: Inter-item Covariance/Low Reliability
|
Administrator
|
Would be interesting to see the eigenvalues and communalities of the correlation matrix of the items in your scale. You can get these from FACTOR.
If these results are consistent with the RELIABILITY there should be at least 1 VERY small (close to 0) eigenvalue and at least 1 variable with a large (close to 1) communality. That variable with large communality is likely the culprit in the singular matrix issue.
Please reply to the list and not to my personal email.
Those desiring my consulting or training services please feel free to email me. --- "Nolite dare sanctum canibus neque mittatis margaritas vestras ante porcos ne forte conculcent eas pedibus suis." Cum es damnatorum possederunt porcos iens ut salire off sanguinum cliff in abyssum?" |
|
First, I computed this:
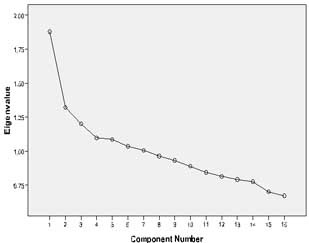
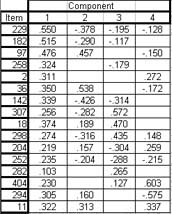
FACTOR /VARIABLES s002 s011 s018 s036 s097 s142 s182 s204 s229 s252 s258 s282 s294 s298 s307 s404 /MISSING LISTWISE /ANALYSIS s002 s011 s018 s036 s097 s142 s182 s204 s229 s252 s258 s282 s294 s298 s307 s404 /PRINT INITIAL CORRELATION KMO EXTRACTION /FORMAT SORT BLANK(.10) /PLOT EIGEN /CRITERIA MINEIGEN(1) ITERATE(25) /EXTRACTION PC /ROTATION NOROTATE /METHOD=CORRELATION. KMO measure of sampling adequacy = .627 (p= .000) The communalities (extraction) for the 16 items vary from .376 (item s252) to .677 (item s204). Total variance explained: SPSS finds 16 factors. According to the scree plot, I'd choose 4 factors.  After that, I did rotation with the 4 factors: FACTOR /VARIABLES s002 s011 s018 s036 s097 s142 s182 s204 s229 s252 s258 s282 s294 s298 s307 s404 /MISSING LISTWISE /ANALYSIS s002 s011 s018 s036 s097 s142 s182 s204 s229 s252 s258 s282 s294 s298 s307 s404 /FORMAT SORT BLANK(.10) /CRITERIA FACTORS(4) ITERATE(25) /EXTRACTION PC /CRITERIA ITERATE(25) /ROTATION VARIMAX /METHOD=CORRELATION. (Now, communalities vary from .082 (item s282) to .501. (item s229).) The component matrix shows the following factor loadings:  So unfortunately, all items load on at least 2 components and asses more than one construct. I tried to label the components/constructs. Due to the fact, that the scale measures somatic malingering in general, I tried to find out whether an item measures rather 'rare head complaints' or 'rare gastrointestinal complaints. Actually, there is not such a distinct category and I could not name any component. All items measure different rare symptoms, and I can't picture what the particular distinction between the components is supposed to be. |
|
Should I post all communalities and eigenvalues in order to provide a better overview?
As the results after rotation show, item s082 is close to zero (.082). But there's no item close to 1. |
Re: Inter-item Covariance/Low Reliability
|
In reply to this post by SylviP
What was your sample size? To get a decent factor analysis with 16 items you
probably need a minimum of around 80 subjects. The KMO (.627) is rather low, suggesting it might be difficult to find a clean solution. Assuming your sample size is adequate, try a few variations: - Dropping low communality items - Rotating a different number of factors - Oblique (e.g. oblimin) rotation If you still can't find a satisfactory solution (i.e. factors that make substantive sense/can be named) you'll have to resign yourself to the fact your questionnaire cannot be factorized. This could be because the item set doesn't reflect distinct underlying constructs. Garry Gelade Business Analytic Ltd. -----Original Message----- From: SPSSX(r) Discussion [mailto:[hidden email]] On Behalf Of SylviP Sent: 16 March 2011 14:20 To: [hidden email] Subject: Re: Inter-item Covariance/Low Reliability First, I computed this: FACTOR /VARIABLES s002 s011 s018 s036 s097 s142 s182 s204 s229 s252 s258 s282 s294 s298 s307 s404 /MISSING LISTWISE /ANALYSIS s002 s011 s018 s036 s097 s142 s182 s204 s229 s252 s258 s282 s294 s298 s307 s404 /PRINT INITIAL CORRELATION KMO EXTRACTION /FORMAT SORT BLANK(.10) /PLOT EIGEN /CRITERIA MINEIGEN(1) ITERATE(25) /EXTRACTION PC /ROTATION NOROTATE /METHOD=CORRELATION. KMO measure of sampling adequacy = .627 (p= .000) The communalities (extraction) for the 16 items vary from .376 (item s252) to .677 (item s204). Total variance explained: SPSS finds 16 factors. According to the scree plot, I'd choose 4 factors. http://spssx-discussion.1045642.n5.nabble.com/file/n3782494/screeplot.jpg After that, I did rotation with the 4 factors: FACTOR /VARIABLES s002 s011 s018 s036 s097 s142 s182 s204 s229 s252 s258 s282 s294 s298 s307 s404 /MISSING LISTWISE /ANALYSIS s002 s011 s018 s036 s097 s142 s182 s204 s229 s252 s258 s282 s294 s298 s307 s404 /FORMAT SORT BLANK(.10) /CRITERIA FACTORS(4) ITERATE(25) /EXTRACTION PC /CRITERIA ITERATE(25) /ROTATION VARIMAX /METHOD=CORRELATION. (Now, communalities vary from .082 (item s282) to .501. (item s229).) The component matrix shows the following factor loadings: http://spssx-discussion.1045642.n5.nabble.com/file/n3782494/factorloadings.j pg So unfortunately, all items load on at least 2 components and asses more than one construct. I tried to label the components/constructs. Due to the fact, that the scale measures somatic malingering in general, I tried to find out whether an item measures rather 'rare head complaints' or 'rare gastrointestinal complaints. Actually, there is not such a distinct category and I could not name any component. All items measure different rare symptoms, and I can't picture what the particular distinction between the components is supposed to be. -- View this message in context: http://spssx-discussion.1045642.n5.nabble.com/Inter-item-Covariance-Low-Reli ability-tp3408731p3782494.html Sent from the SPSSX Discussion mailing list archive at Nabble.com. ===================== To manage your subscription to SPSSX-L, send a message to [hidden email] (not to SPSSX-L), with no body text except the command. To leave the list, send the command SIGNOFF SPSSX-L For a list of commands to manage subscriptions, send the command INFO REFCARD ===================== To manage your subscription to SPSSX-L, send a message to [hidden email] (not to SPSSX-L), with no body text except the command. To leave the list, send the command SIGNOFF SPSSX-L For a list of commands to manage subscriptions, send the command INFO REFCARD |
«
Return to SPSSX Discussion
|
1 view|%1 views
| Free forum by Nabble | Edit this page |

