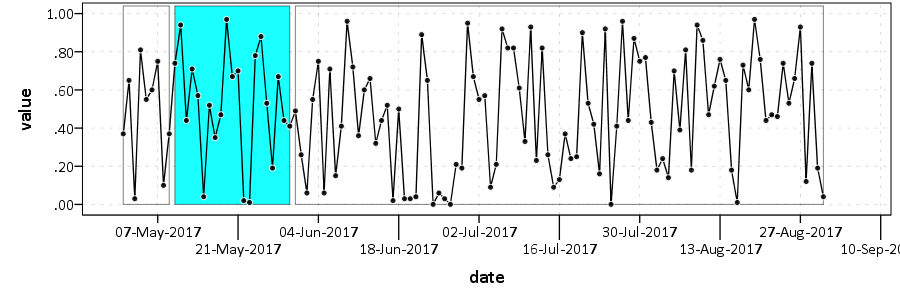
Line graph with polygon and date variable on axis X
|
Hi,
=====================
To manage your subscription to SPSSX-L, send a message to
[hidden email] (not to SPSSX-L), with no body text except the
command. To leave the list, send the command
SIGNOFF SPSSX-L
For a list of commands to manage subscriptions, send the command
INFO REFCARD
I want to make line graph with polygon and date variable on axis X. I can do this with numeric variable 'id' on axis x, but i can' t with date. data for example. INPUT PROGRAM. loop #i EQ 1 to 123. numeric id(f8.0). compute id EQ #i. end case. end loop. end file. END INPUT PROGRAM. EXECUTE. DATASET NAME BD1. DO if id EQ 1. COMPUTE date EQ 13712976000. ELSE IF id NE 1. COMPUTE date EQ 0. end if. execute. IF date EQ 0 date EQ lag(date, 1) +86400. execute. formats date (date10). COMPUTE v1 EQ trunc(RV.UNIFORM(0, 1), 0.01). EXECUTE. graph with numeric variable 'id' GGRAPH /GRAPHDATASET NAME="graphdataset" VARIABLES= id date v1 MISSING=LISTWISE REPORTMISSING=NO /GRAPHSPEC SOURCE=INLINE. BEGIN GPL PAGE: begin(scale(900px,300px)) SOURCE: s=userSource(id("graphdataset")) DATA: id=col(source(s), name("id")) DATA: date=col(source(s), name("date"), unit.time()) DATA: v1=col(source(s), name("v1")) GUIDE: axis(dim(1), label("date")) GUIDE: axis(dim(2), label("value")) SCALE: linear(dim(2), min(0), max(1)) ELEMENT: line(position(id*v1), missing.wings()) TRANS: bottom=eval(0) TRANS: top=eval(1.2) TRANS: begin=eval(10) TRANS: end=eval(30) ELEMENT: polygon(position(link.hull((begin+end)*(bottom+top))), color.interior(color.aqua), transparency.interior(transparency."0.6"), transparency.exterior(transparency."1")) ELEMENT: point(position(id*v1), color.interior(color.black), shape(shape.circle), transparency.exterior(transparency."0.1"), transparency.interior(transparency."0.1"), size(size."12"), color.exterior(color.white)) PAGE: end() END GPL. How should I modify this to do the same with date variable? |
|
Here is the easiest way I can figure out. Boxes are still included for educational purposes, you can get rid of them by making the exterior of the boxes transparent.
*****************************************. COMPUTE #B = DATE.MDY(5,10,2017). COMPUTE #E = DATE.MDY(5,30,2017). DO IF date < #B. COMPUTE Inside = 0. ELSE IF RANGE(date,#B,#E). COMPUTE Inside = 1. ELSE IF date > #E. COMPUTE Inside = 2. END IF. EXECUTE. FORMATS Inside (F1.0). EXECUTE. *In the polygon element change [transparency.exterior(transparency."0.5")] to. *[transparency.exterior(transparency."1")] to prevent the outside of the boxes being drawn. GGRAPH /GRAPHDATASET NAME="graphdataset" VARIABLES= id date v1 Inside MISSING=VARIABLEWISE /GRAPHSPEC SOURCE=INLINE. BEGIN GPL PAGE: begin(scale(900px,300px)) SOURCE: s=userSource(id("graphdataset")) DATA: id=col(source(s), name("id")) DATA: date=col(source(s), name("date"), unit.time()) DATA: Inside=col(source(s), name("Inside"), unit.category()) DATA: v1=col(source(s), name("v1")) GUIDE: axis(dim(1), label("date")) GUIDE: axis(dim(2), label("value")) GUIDE: legend(aesthetic(aesthetic.color.interior), null()) GUIDE: legend(aesthetic(aesthetic.transparency.interior), null()) SCALE: linear(dim(2), min(0), max(1)) TRANS: bottom=eval(0) TRANS: top=eval(1.04) SCALE: cat(aesthetic(aesthetic.color.interior), map(("1",color.aqua))) SCALE: cat(aesthetic(aesthetic.transparency.interior), map(("0",transparency."1"),("1",transparency."0.1"),("2",transparency."1"))) ELEMENT: polygon(position(link.hull(date*(bottom+top))), color.interior(Inside), transparency.interior(Inside), transparency.exterior(transparency."0.5")) ELEMENT: line(position(date*v1)) ELEMENT: point(position(date*v1), color.interior(color.black), shape(shape.circle), transparency.exterior(transparency."0.1"), transparency.interior(transparency."0.1"), size(size."6"), color.exterior(color.white)) PAGE: end() END GPL. *****************************************.  I have never been able to figure out how SPSS graphs encodes time variables. I may have to file a bug report as well with this, the blending with link.hull seems to me to be misbehaving with some of the time variables and missing data. |
|
In reply to this post by 88videos
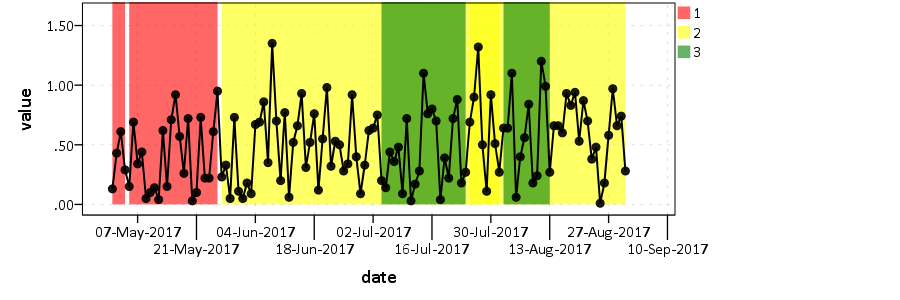
I am very grateful for your help Andy, I was testing your method in a few instances, and to be honest I need more cues :) Let's say I got only 5 observations, rest is missing. compute #D1 = date.dmy(8, 6, 2017). compute #D2 = date.dmy(14, 7, 2017). compute #D3 = date.dmy(27, 7, 2017). compute #D4 = date.dmy(4, 8, 2017). compute #D5 = date.dmy(11, 8, 2017). if date = #D1 v1 = 1.35. if date = #D2 v1 = 1.1. if date = #D3 v1 = 1.32. if date = #D4 v1 = 1.1. if date = #D5 v1 = 1.2. execute. And the task is to mark by 3 colors (red, yellow, green) 5 periods. 1) Because of the missing I have dotted line. What to do to have all data points connected? 2) I am curious why when I make variable 'Inside' with 3 values graph is not what I expected? With 5 values is ok. a) with 3 values do repeat a =#A1 to #A6 / b = 5 26 3 24 1 13 / c = 5 5 7 7 8 8. compute a = date.dmy(b, c, 2017). end repeat. DO IF range (date, #A1, #A2). COMPUTE Inside = 1. ELSE IF range (date, #A2, #A3). COMPUTE Inside = 2. ELSE IF range (date, #A3, #A4). COMPUTE Inside = 3. ELSE IF range (date, #A4, #A5). COMPUTE Inside = 2. ELSE IF range (date, #A5, #A6). COMPUTE Inside = 3. END IF. EXECUTE. FORMATS Inside (F1.0). EXECUTE. GGRAPH /GRAPHDATASET NAME="graphdataset" VARIABLES= id date v1 Inside MISSING=VARIABLEWISE /GRAPHSPEC SOURCE=INLINE. BEGIN GPL PAGE: begin(scale(900px,300px)) SOURCE: s=userSource(id("graphdataset")) DATA: id=col(source(s), name("id")) DATA: date=col(source(s), name("date"), unit.time()) DATA: Inside=col(source(s), name("Inside"), unit.category()) DATA: v1=col(source(s), name("v1")) GUIDE: axis(dim(1), label("date")) GUIDE: axis(dim(2), label("value")) GUIDE: legend(aesthetic(aesthetic.color.interior), null()) GUIDE: legend(aesthetic(aesthetic.transparency.interior), null()) SCALE: linear(dim(2), min(0), max(1.6)) TRANS: bottom=eval(0) TRANS: top=eval(2) SCALE: cat(aesthetic(aesthetic.color.interior), map(("1",color.red), ("2",color.yellow), ("3",color.green))) ELEMENT: polygon(position(link.hull(date*(bottom+top))), color.interior(Inside), transparency.interior(transparency."0.4"), transparency.exterior(transparency."1")) ELEMENT: line(position(date*v1), size(size."2")) ELEMENT: point(position(date*v1), color.interior(color.black), shape(shape.circle), transparency.exterior(transparency."0.1"), transparency.interior(transparency."0.1"), size(size."8"), color.exterior(color.black)) PAGE: end() END GPL. *****************************************. b) with 5 values do repeat a =#A1 to #A6 / b = 5 26 3 24 1 13 / c = 5 5 7 7 8 8. compute a = date.dmy(b, c, 2017). end repeat. DO IF range (date, #A1, #A2). COMPUTE Inside = 1. ELSE IF range (date, #A2, #A3). COMPUTE Inside = 2. ELSE IF range (date, #A3, #A4). COMPUTE Inside = 3. ELSE IF range (date, #A4, #A5). COMPUTE Inside = 4. ELSE IF range (date, #A5, #A6). COMPUTE Inside = 5. END IF. EXECUTE. FORMATS Inside (F1.0). EXECUTE. GGRAPH /GRAPHDATASET NAME="graphdataset" VARIABLES= id date v1 Inside MISSING=VARIABLEWISE /GRAPHSPEC SOURCE=INLINE. BEGIN GPL PAGE: begin(scale(900px,300px)) SOURCE: s=userSource(id("graphdataset")) DATA: id=col(source(s), name("id")) DATA: date=col(source(s), name("date"), unit.time()) DATA: Inside=col(source(s), name("Inside"), unit.category()) DATA: v1=col(source(s), name("v1")) GUIDE: axis(dim(1), label("date")) GUIDE: axis(dim(2), label("value")) GUIDE: legend(aesthetic(aesthetic.color.interior), null()) GUIDE: legend(aesthetic(aesthetic.transparency.interior), null()) SCALE: linear(dim(2), min(0), max(1.6)) TRANS: bottom=eval(0) TRANS: top=eval(2) SCALE: cat(aesthetic(aesthetic.color.interior), map(("1",color.red), ("2",color.yellow), ("3",color.green), ("4",color.yellow), ("5",color.green))) ELEMENT: polygon(position(link.hull(date*(bottom+top))), color.interior(Inside), transparency.interior(transparency."0.4"), transparency.exterior(transparency."1")) ELEMENT: line(position(date*v1), size(size."2")) ELEMENT: point(position(date*v1), color.interior(color.black), shape(shape.circle), transparency.exterior(transparency."0.1"), transparency.interior(transparency."0.1"), size(size."8"), color.exterior(color.black)) PAGE: end() END GPL. *****************************************. This solved my problem partly, because I need legend with 3 boxes(red, yellow, green). If I use variable 'Inside' with 5 values in legend will appear twice box with color green and yellow. GGRAPH /GRAPHDATASET NAME="graphdataset" VARIABLES= id date v1 Inside MISSING=VARIABLEWISE /GRAPHSPEC SOURCE=INLINE. BEGIN GPL PAGE: begin(scale(900px,300px)) SOURCE: s=userSource(id("graphdataset")) DATA: id=col(source(s), name("id")) DATA: date=col(source(s), name("date"), unit.time()) DATA: Inside=col(source(s), name("Inside"), unit.category()) DATA: v1=col(source(s), name("v1")) GUIDE: axis(dim(1), label("date")) GUIDE: axis(dim(2), label("value")) GUIDE: legend(aesthetic(aesthetic.color.interior)) GUIDE: legend(aesthetic(aesthetic.transparency.interior), null()) SCALE: linear(dim(2), min(0), max(1.6)) TRANS: bottom=eval(0) TRANS: top=eval(2) SCALE: cat(aesthetic(aesthetic.color.interior), map(("1",color.red), ("2",color.yellow), ("3",color.green), ("4",color.yellow), ("5",color.green))) ELEMENT: polygon(position(link.hull(date*(bottom+top))), color.interior(Inside), transparency.interior(transparency."0.4"), transparency.exterior(transparency."1")) ELEMENT: line(position(date*v1), size(size."2")) ELEMENT: point(position(date*v1), color.interior(color.black), shape(shape.circle), transparency.exterior(transparency."0.1"), transparency.interior(transparency."0.1"), size(size."8"), color.exterior(color.black)) PAGE: end() END GPL. *****************************************. Thanks for your time ANDY!!! 2017-08-13 0:00 GMT+02:00 Kamil <[hidden email]>:
|
|
Use split to accomplish what you want.
****************************************************. RECODE Inside (0,1 = 1)(2,4 = 2)(3,5 = 3) INTO In2. FORMATS In2 (F1.0). EXECUTE. GGRAPH /GRAPHDATASET NAME="graphdataset" VARIABLES= id date v1 Inside In2 MISSING=VARIABLEWISE /GRAPHSPEC SOURCE=INLINE. BEGIN GPL PAGE: begin(scale(900px,300px)) SOURCE: s=userSource(id("graphdataset")) DATA: id=col(source(s), name("id")) DATA: date=col(source(s), name("date"), unit.time()) DATA: Inside=col(source(s), name("Inside"), unit.category()) DATA: In2=col(source(s), name("In2"), unit.category()) DATA: v1=col(source(s), name("v1")) GUIDE: axis(dim(1), label("date")) GUIDE: axis(dim(2), label("value")) GUIDE: legend(aesthetic(aesthetic.color.interior)) GUIDE: legend(aesthetic(aesthetic.transparency.interior), null()) SCALE: linear(dim(2), min(0), max(1.6)) TRANS: bottom=eval(0) TRANS: top=eval(2) SCALE: cat(aesthetic(aesthetic.color.interior), map(("1",color.red), ("2",color.yellow), ("3",color.green))) ELEMENT: polygon(position(link.hull(date*(bottom+top))), color.interior(In2), transparency.interior(transparency."0.4"), transparency.exterior(transparency."1"), split(Inside)) ELEMENT: line(position(date*v1), size(size."2")) ELEMENT: point(position(date*v1), color.interior(color.black), shape(shape.circle), transparency.exterior(transparency."0.1"), transparency.interior(transparency."0.1"), size(size."8"), color.exterior(color.black)) PAGE: end() END GPL. ****************************************************.  Not sure why green and yellow in those examples do not have any spaces but red does though. I think one way to make them cover the entire time is to insert some dummy dates with missing data for v1. Also avoid putting red and green in the same palette - colorblindness. See http://colorbrewer2.org/#type=qualitative&scheme=Accent&n=3 for advice on qualitative palettes. |
«
Return to SPSSX Discussion
|
1 view|%1 views
| Free forum by Nabble | Edit this page |

