different fit lines for different groups
different fit lines for different groups
|
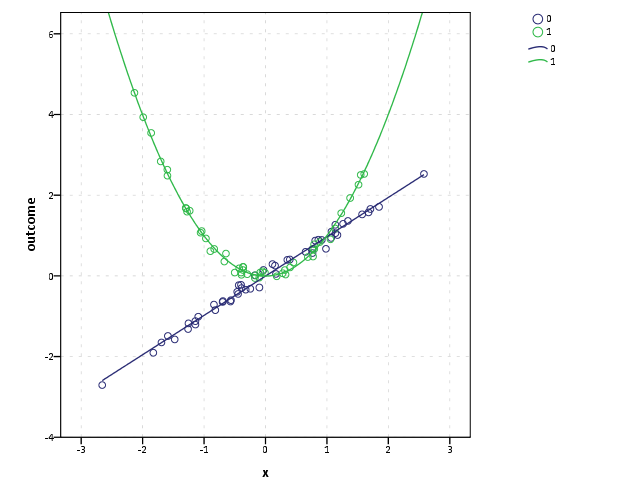
Is it possible to customize via GPL a scatterplot with 2 groups of
points (defined by a grouping variable) so that fit lines for the 2
groups be different functions. For example, linear fit for GROUP=1
cloud and cubic fit for GROUP=2 cloud.
|
|
Here is the best solution I could come up with. In a nutshell it makes two grouping variables and then maps the one group to a 100% transparent element. Then it just has two element calls in the GPL (in this example one for linear and one for quadratic). Of course the most flexible solution would be to actually fit the models for each group and put the predicted values as a new variable in the dataset, but this didn't work out too badly (the legend didn't even turn out that badly). 
|
Re: different fit lines for different groups
|
In reply to this post by Kirill Orlov
Use CASESTOVARS to restructure the file and then specify two ELEMENT statements. From: SPSSX(r) Discussion [mailto:[hidden email]] On Behalf Of Kirill Orlov Is it possible to customize via GPL a scatterplot with 2 groups of points (defined by a grouping variable) so that fit lines for the 2 groups be different functions. For example, linear fit for GROUP=1 cloud and cubic fit for GROUP=2 cloud. |
| Free forum by Nabble | Edit this page |

