landmark analysis survival
|
Hi Everone,
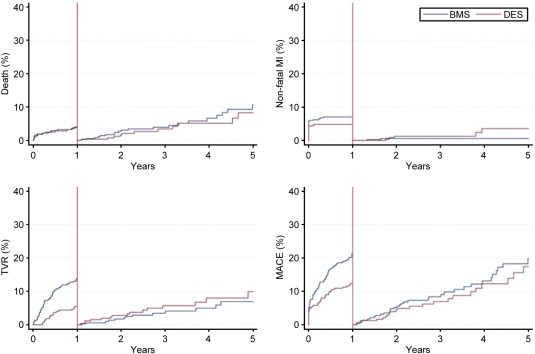
I'm interested in doing a landmark survival analysis with SPSS, comparing therapy1 vs therapy2, before and after a landmark (t=xx months). Like this image.  A step-by-step approach would be great, as i'm not yet that proficient in SPSS. Many thanks in advance Kdoc. |
Re: landmark analysis survival
|
So, it looks like the key element to the analysis is to identify which people have experienced the event prior to the landmark and remove them and then reset the time clock to be 0.00 at the landmark. Everybody who has not experienced the event remains in the analysis with a survival time of 0 at the landmark. Is that how you understand it? If we're in agreement, you should describe your data and whether you are planning a continuous time analysis or a discrete time analysis.
Gene Maguin -----Original Message----- From: SPSSX(r) Discussion [mailto:[hidden email]] On Behalf Of kdoc Sent: Thursday, March 14, 2013 7:56 AM To: [hidden email] Subject: landmark analysis survival Hi Everone, I'm interested in doing a landmark survival analysis with SPSS, comparing therapy1 vs therapy2, before and after a landmark (t=xx months). Like this image. <http://spssx-discussion.1045642.n5.nabble.com/file/n5718644/landmark.jpg> A step-by-step approach would be great, as i'm not yet that proficient in SPSS. Many thanks in advance Kdoc. -- View this message in context: http://spssx-discussion.1045642.n5.nabble.com/landmark-analysis-survival-tp5718644.html Sent from the SPSSX Discussion mailing list archive at Nabble.com. ===================== To manage your subscription to SPSSX-L, send a message to [hidden email] (not to SPSSX-L), with no body text except the command. To leave the list, send the command SIGNOFF SPSSX-L For a list of commands to manage subscriptions, send the command INFO REFCARD ===================== To manage your subscription to SPSSX-L, send a message to [hidden email] (not to SPSSX-L), with no body text except the command. To leave the list, send the command SIGNOFF SPSSX-L For a list of commands to manage subscriptions, send the command INFO REFCARD |
|
This post was updated on .
In reply to this post by kdoc
Thank you for your answer.
I'm not sure to understand your answer. can you please detail the procedure, if you can.
Because what I want is to draw Kaplan-Meier curve, with landmarks at 3 and 6 years.
I put above my database.
landmark.xls
|
|
Administrator
|
The XLS sheet you attached bears little or no relationship to the graphs you posted in your first message.
Either something has been lost in transmission or you are trying to make a silk purse from a sow's ear. Perhaps help us correlate your two messages. It seems to me that these data are insufficient to do any sort of stats. -- event event_time_yy grp_time 1 0.7 1 1 1.7 1 1 2.9 1 1 3.1 2 1 3.1 2 1 4 2 1 4 2 1 5 2 1 5.1 2 1 5.4 2 1 5.6 2 1 6 2 1 6.2 2 1 8.2 3 1 8.7 3 1 9.8 3 0 10 0 10 0 10 0 10 0 10 0 10 0 10 ....... repeated down to line 107.
Please reply to the list and not to my personal email.
Those desiring my consulting or training services please feel free to email me. --- "Nolite dare sanctum canibus neque mittatis margaritas vestras ante porcos ne forte conculcent eas pedibus suis." Cum es damnatorum possederunt porcos iens ut salire off sanguinum cliff in abyssum?" |
|
Good afternoon.
Thank you for your answer.
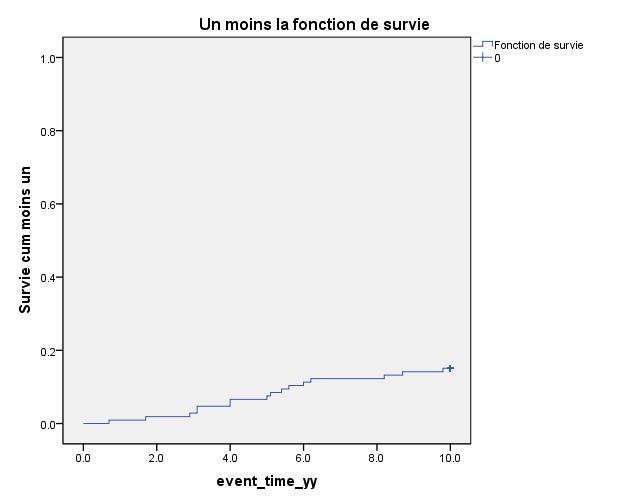
So, with this data in the XLS file. I can draw a Kaplan-Meier curve with SPSS or Stata, as shown below.
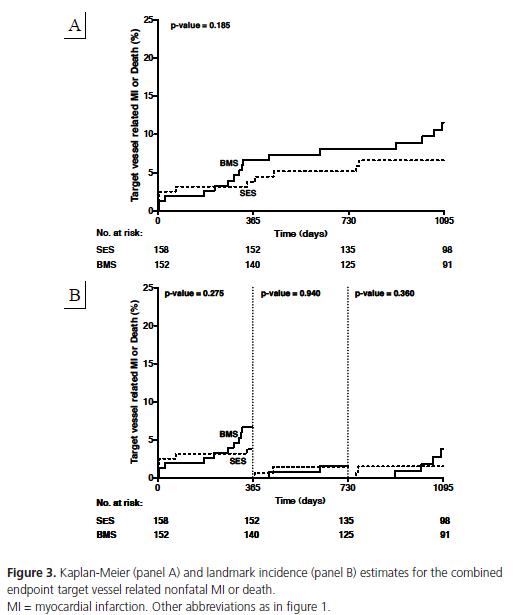
 But what I would like is to add a landmark to my kaplan-meier curve, at 3 and 6 year,
like the picture in my first post or like this one.
 thank you very much in advance.
|
|
Administrator
|
Believe it or not, I don't use KM and you might want to share the syntax used to generate the plot so I'm not wasting time flailing trying to reproduce the image. Maybe there is a way to insert reference lines in the plot . Altrnatively, save it and add lines in ImageJ, GIMP or other Image editing software.
Please reply to the list and not to my personal email.
Those desiring my consulting or training services please feel free to email me. --- "Nolite dare sanctum canibus neque mittatis margaritas vestras ante porcos ne forte conculcent eas pedibus suis." Cum es damnatorum possederunt porcos iens ut salire off sanguinum cliff in abyssum?" |
«
Return to SPSSX Discussion
|
1 view|%1 views
| Free forum by Nabble | Edit this page |


